Loading...
Loading...
Loading...
Loading...
Loading...
Loading...
Loading...
Loading...
Loading...
Loading...
Loading...
Loading...
Loading...
Loading...
Loading...
Loading...
Loading...
Loading...
Checkmate is an open-source, self-hosted tool designed to track and monitor server hardware, uptime, response times, and incidents in real-time with beautiful visualizations.
It uses Capture to get data from remote servers and doesn't need anything other than the Checkmate server itself to monitor uptime and page speed.
We have a demo where you can test how the Uptime Manager works. We update it from time to time with the latest code. The username is [email protected] , and the password is Demouser1!
If you have a question, head over to GitHub's page. We also have a where you can ask questions or provide comments and suggestions.
Completely open source, deployable on your servers
Website monitoring
Memory, disk, CPU and temperature monitoring
Network monitoring
Your support helps keep alive and improving. Sponsorships go toward covering essential infrastructure like servers, domain costs, and email delivery services.
By sponsoring Checkmate, you’re also investing in the ongoing development of a powerful, open-source monitoring tool that gives teams better visibility and control over their systems.
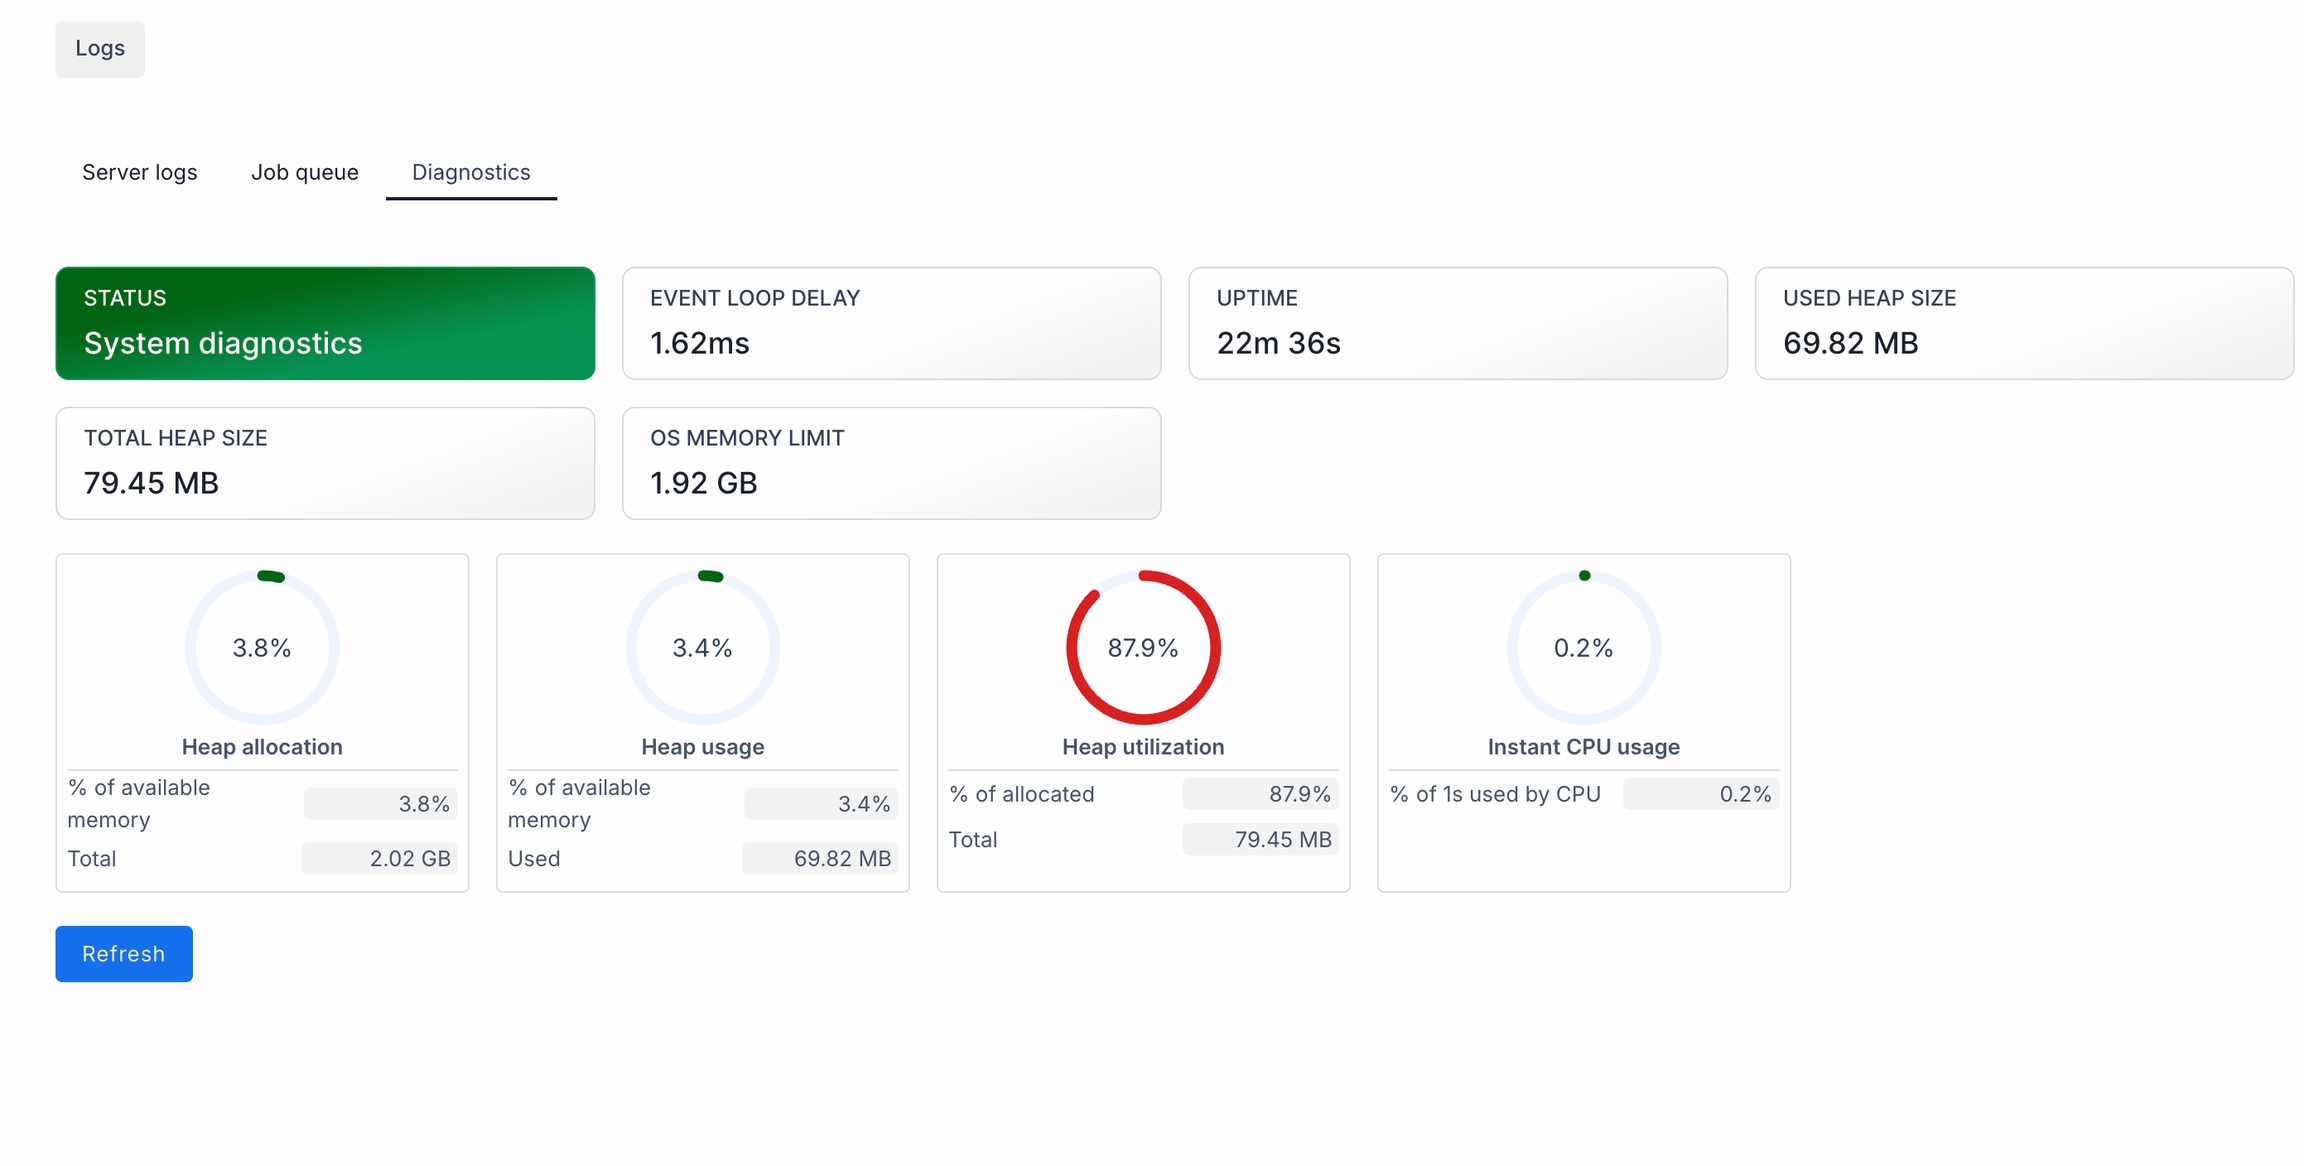
The Logs section shows 3 pieces of information:
Server logs, which contain all log information in the Checkmate backend service.
Job queue, a list of all the jobs that are used to check monitors.
Diagnostics, showing general status of the system's health.
Under the Settings page, you can configure the server's behaviour.
Display timezone: The timezone of the dashboard you publicly display.
Appearance: Here you can select the theme (light or dark), and the dashboard language.
Google PageSpeed API key: You'll need a Google PageSpeed API key if you'd like to use Pagespeed monitor.
Monitor IP/URL on Status Page: Display the IP address or URL of monitor on the public Status page. If it's disabled, only the monitor name will be shown to protect sensitive information.
Monitor history: Define how long you want to keep the data for. You can also remove all past data and clear all stats. Note that clearing data is irreversible.
Global thresholds: Configure global CPU, Memory, Disk, and Temperature thresholds. If a value is provided, it will automatically be enabled for monitoring.
Demo monitors: You can add 3 demo monitors to your platform quickly for testing purposes.
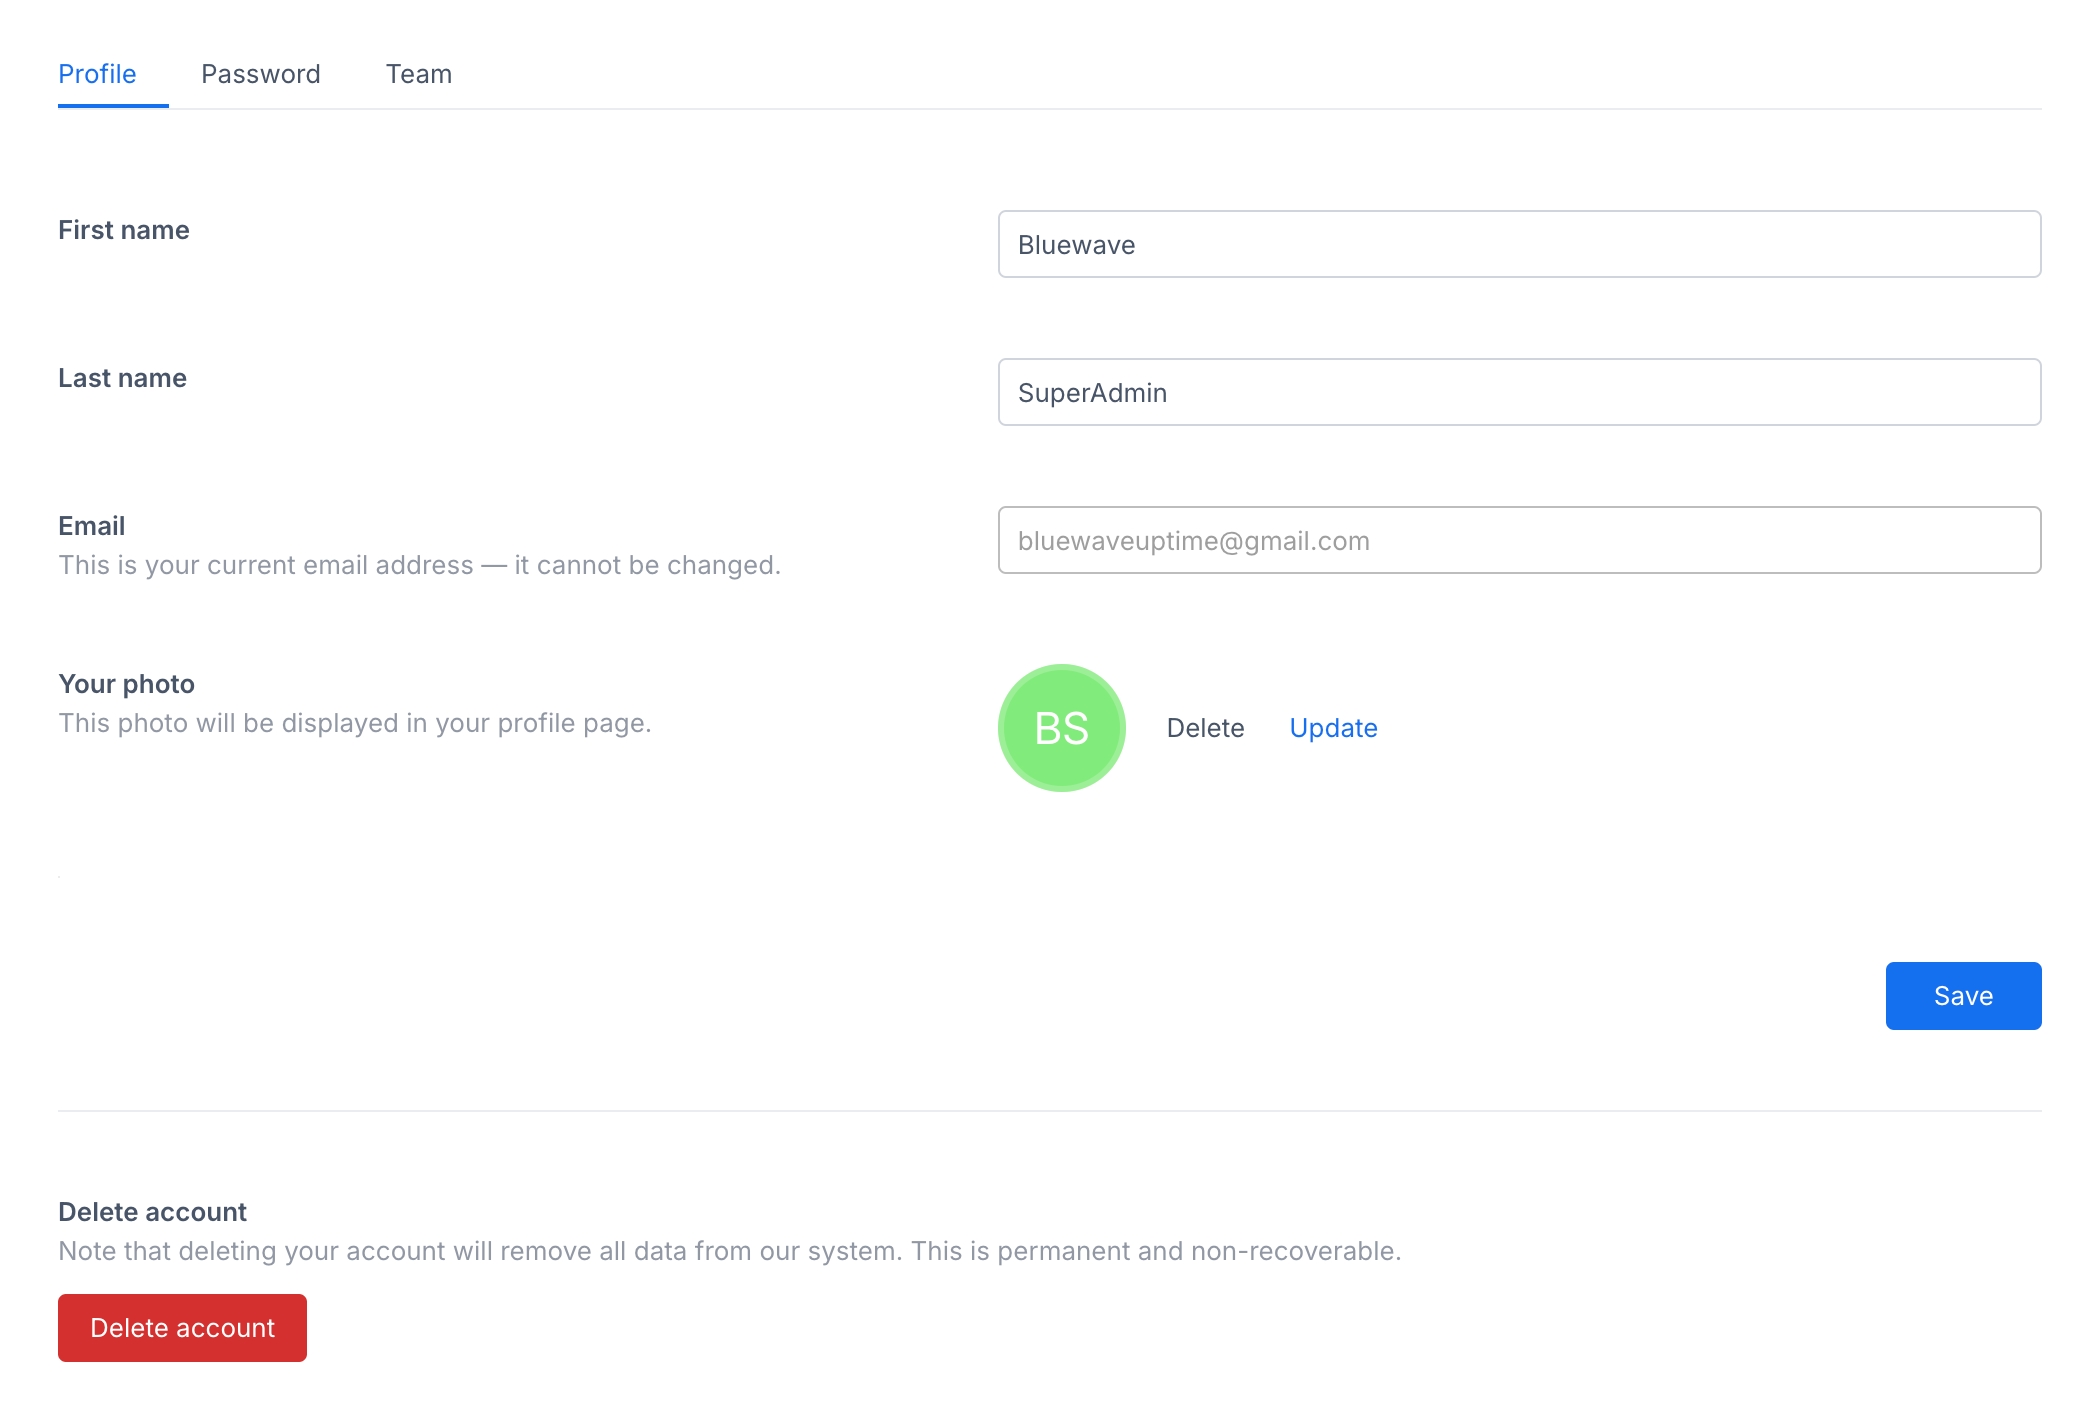
This screen allows you to manage your personal information and account settings within the application.
Enter your first name, last name and email here. You can also upload or delete a profile photo. If you want to delete an account, this can also be done here. Note that that this is irreversible and cannot be undone.
System reset: The system will reset itself, removing all monitors and data associated with them. Note that users will stay intact, but all information related to monitors will be wiped out.
Email settings: You can configure your email settings here. Email is used to send notifications to the administrator.
About: Shows your server's release as well as the latest Checkmate release.
Checkmate is an optimized monitoring solution. While it runs on modest hardware, knowing your hardware requirements is important.
Here is an example: When you have 300 monitors, you'll need 3Gb of disk space each month if they are configured to check in 1 sec periods (intervals). This means that you'll need 36Gb of disk for the entire year to monitor 300 servers.
By default, Checkmate has a data retention policy of 90 days. This can be configured under Settings. Hence, if you need Checkmate to keep longer data periods, you can set it up accordingly.
By default, the Checkmate uses the snappy MongoDB compression method, featuring CPU usage with a moderate compression ratio. This is suitable for workloads where speed is more critical than storage savings. If you want, you can always use zlib in MongoDB configuration, which has a higher compression ratio than snappy but with more CPU overhead.
A notification channel keeps everyone in the loop. It alerts teams when downtime or performance issues crop up, pings engineers the moment incidents occur, and tells administrators about any system changes.
If you create a notification, you can add it to a monitor later.
When you create a notification, it'll ask you the following:
Name: A descriptive name for your notification.
Type: Select the type of notification channel you want to create (e.g Discord)
Each notification has its own configuration. When you select Type, the corresponding configuration will be shown under this section.
Docker monitoring
Game server monitoring
Page speed monitoring
Incident tracking
Status pages
E-mail, Slack, Discord, PagerDuty and webhook notifications
Scheduled maintenance
Audit logs
Multi-language support
Support for Linux, Windows or MacOS host machines
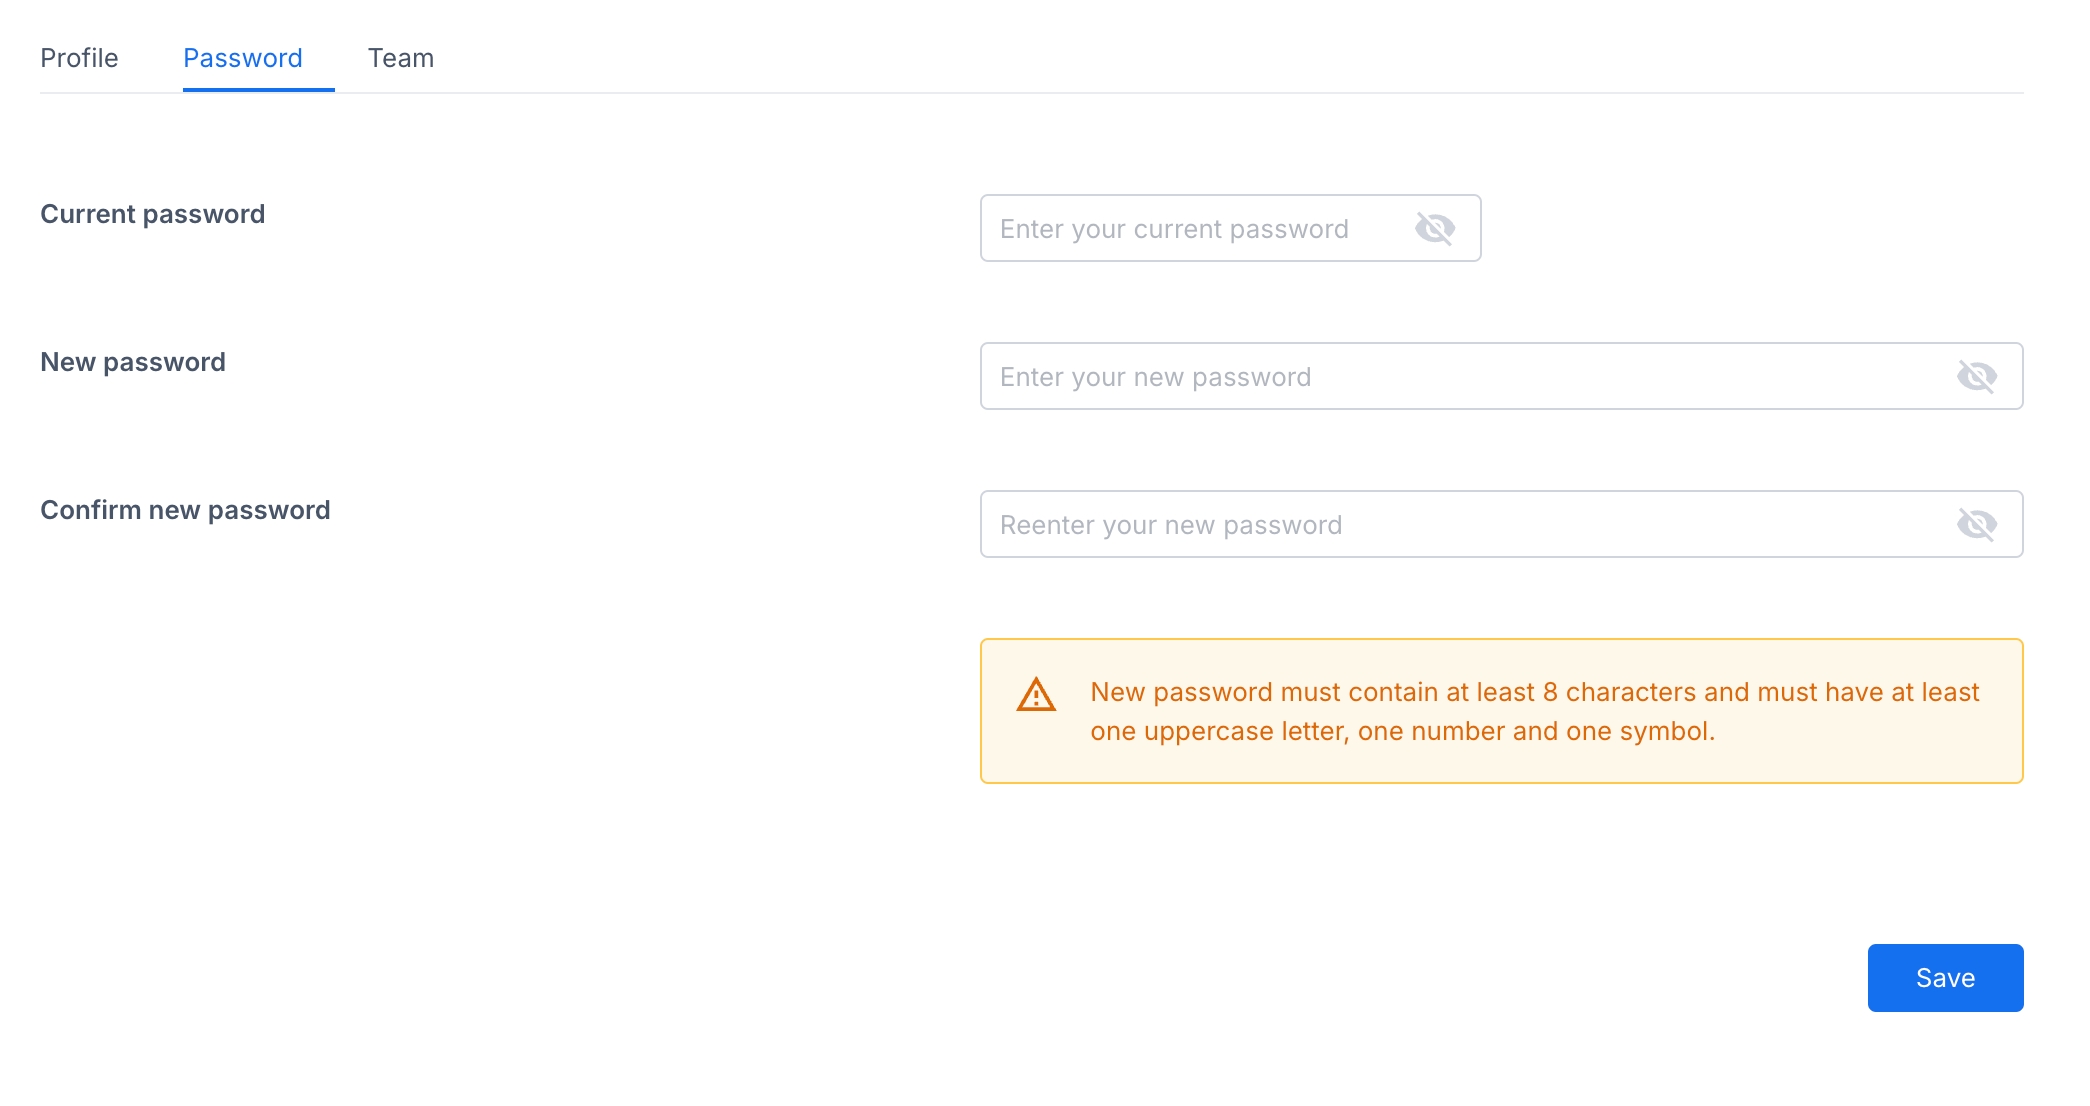
This screen allows you to update your password for your account.
In order to change your password, you need to enter your password, and the new password twice. The new password must meet the specified criteria (e.g., minimum length, uppercase letter, number, symbol).
Additional notes:
Your new password will take effect immediately.
For security reasons, it is recommended to choose a strong password that is difficult to guess.
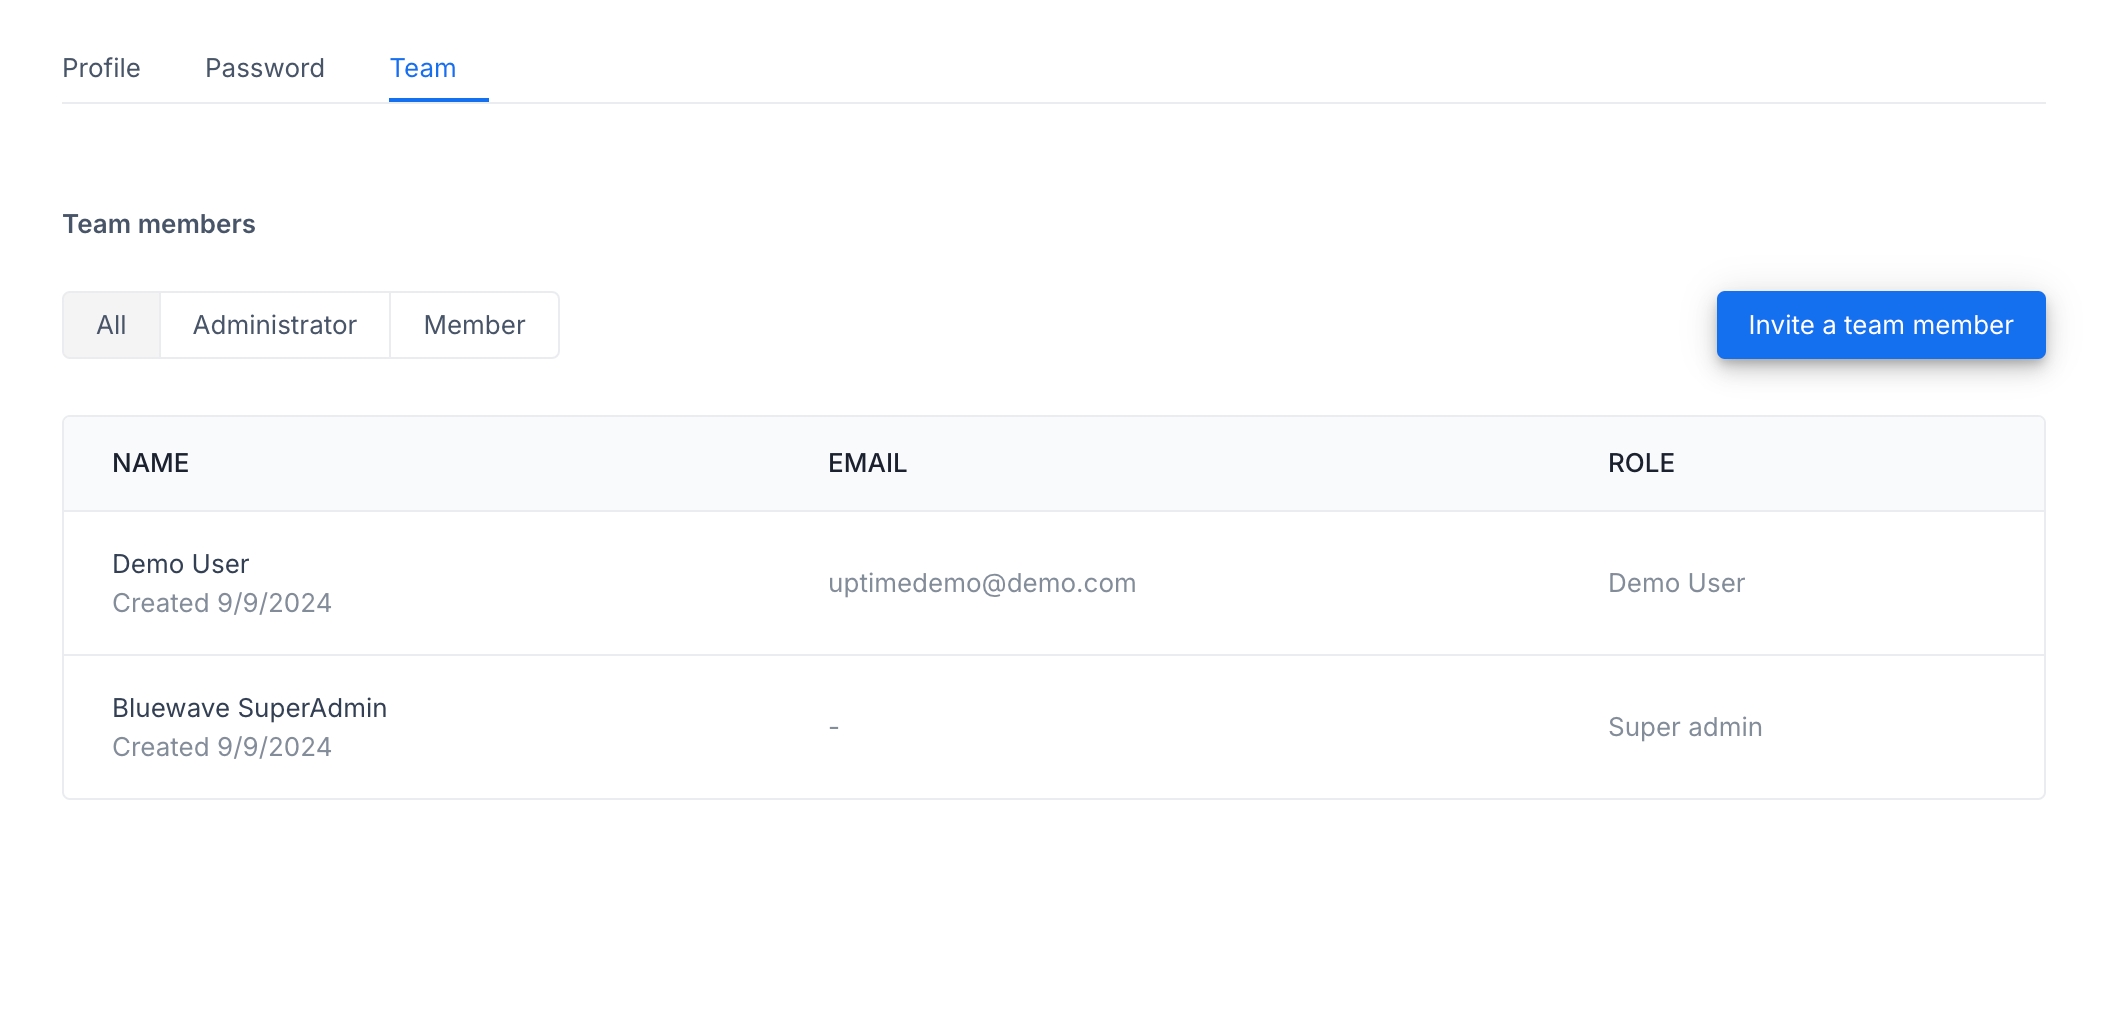
This screen allows you to manage your team members within the application.
Here you can see a list of all users in your system. A user can be either an admin or a member, where an admin can create or delete a monitor, and a user can only view them.
To invite a team member,
Click the "Invite a team member" button.
Enter the email address of the person you want to invite.
Select their desired role (Administrator or Member).
Click "Invite" to send the invitation.
You can also invite a user via token if email doesn't work, or if you want to send a link directly. Click on "Invite a new team member" and then "Get token" to generate this link.
The invited team member will receive an email invitation to join your team.
Admin also has the option to edit or remove existing team members.
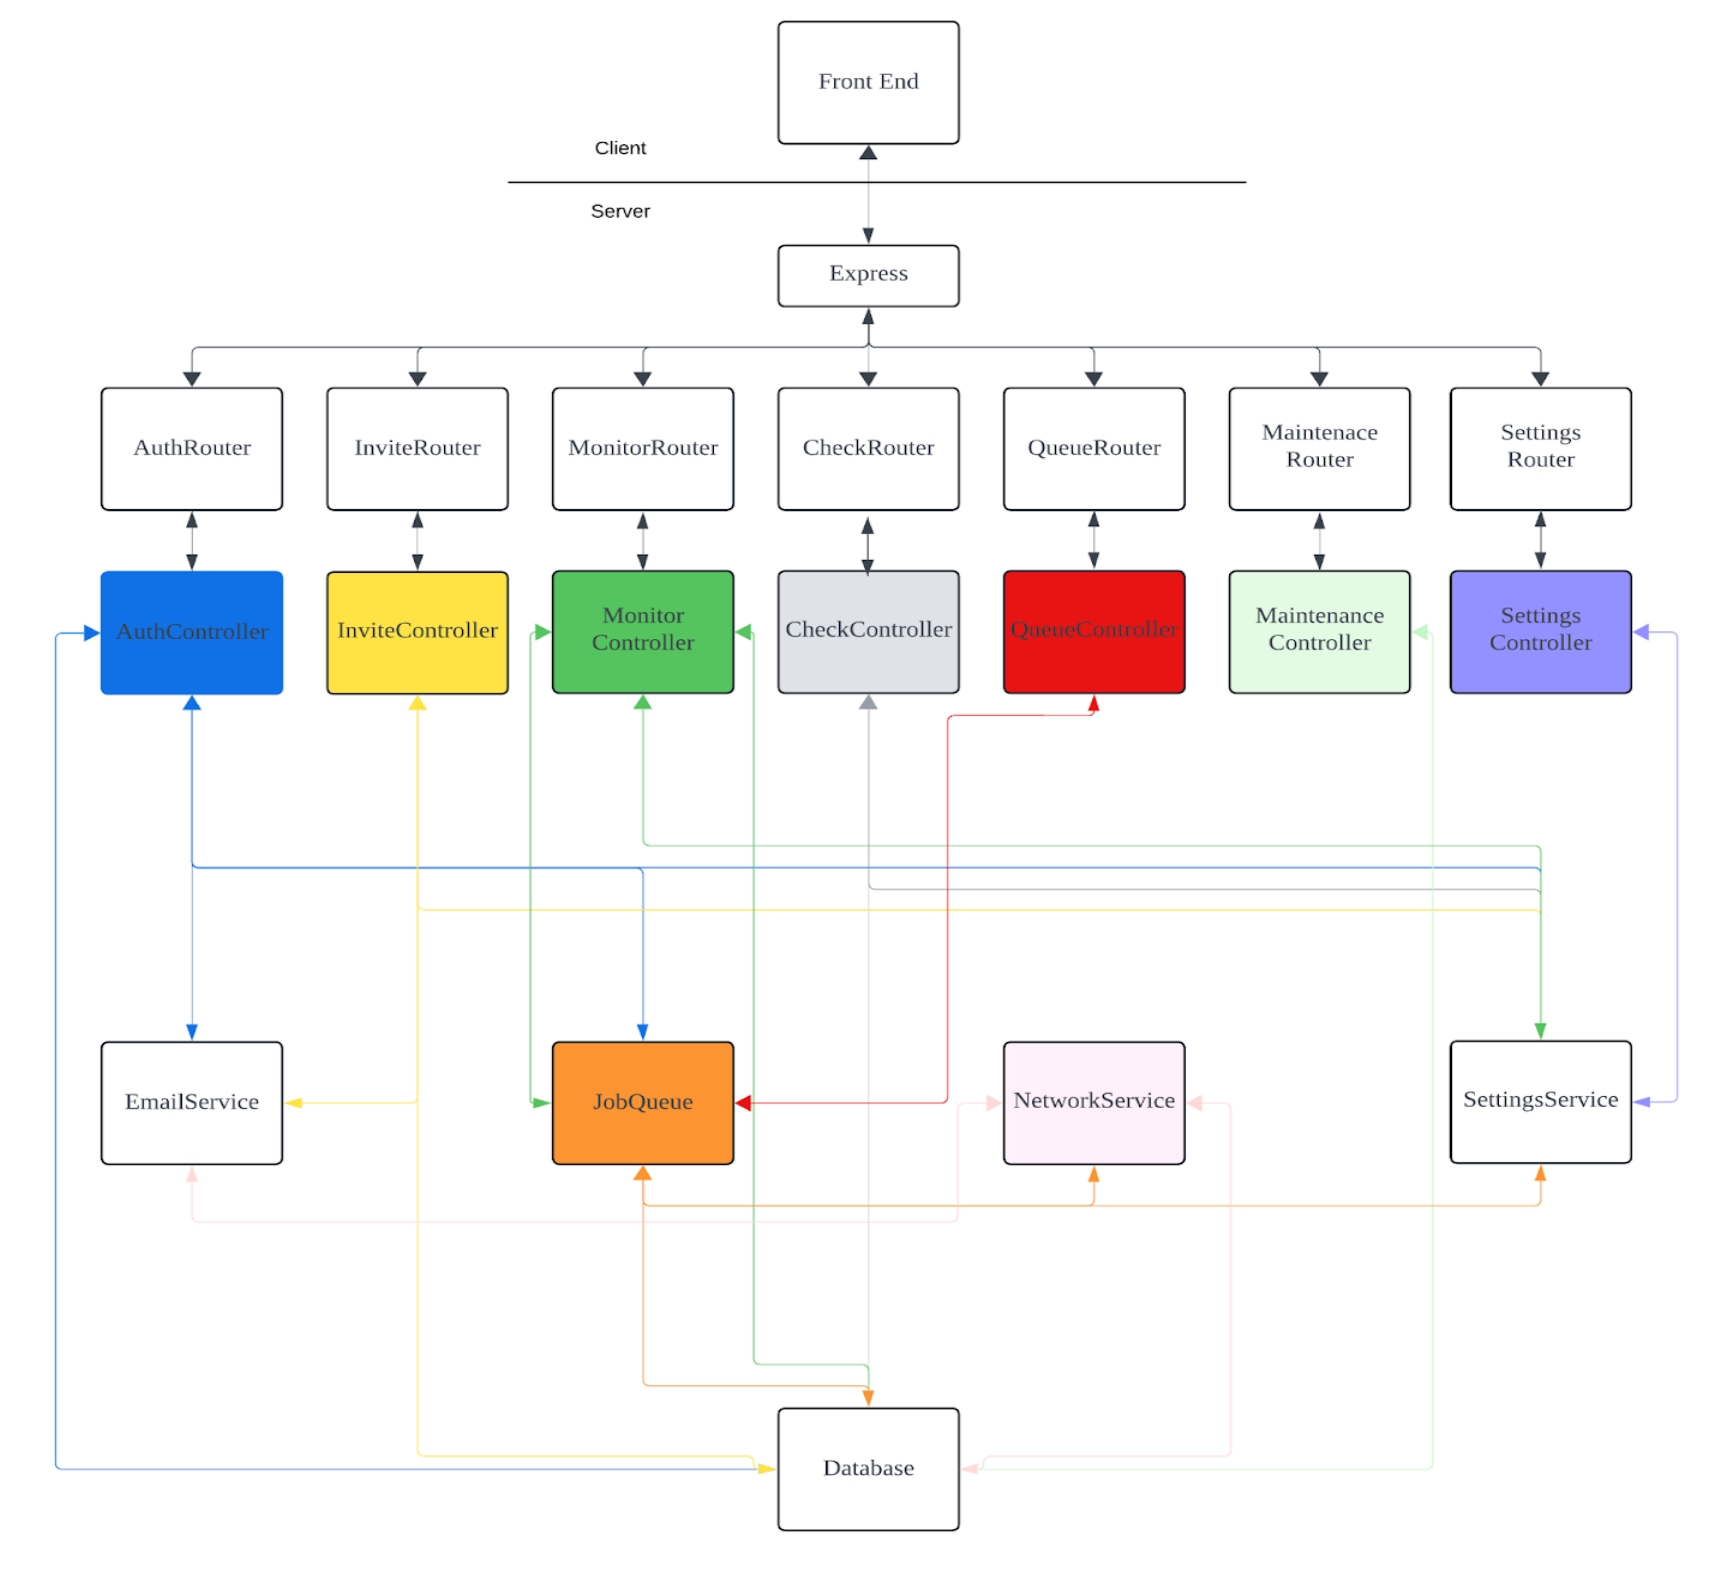
The figure below shows a high level architecture of the Uptime Manager.
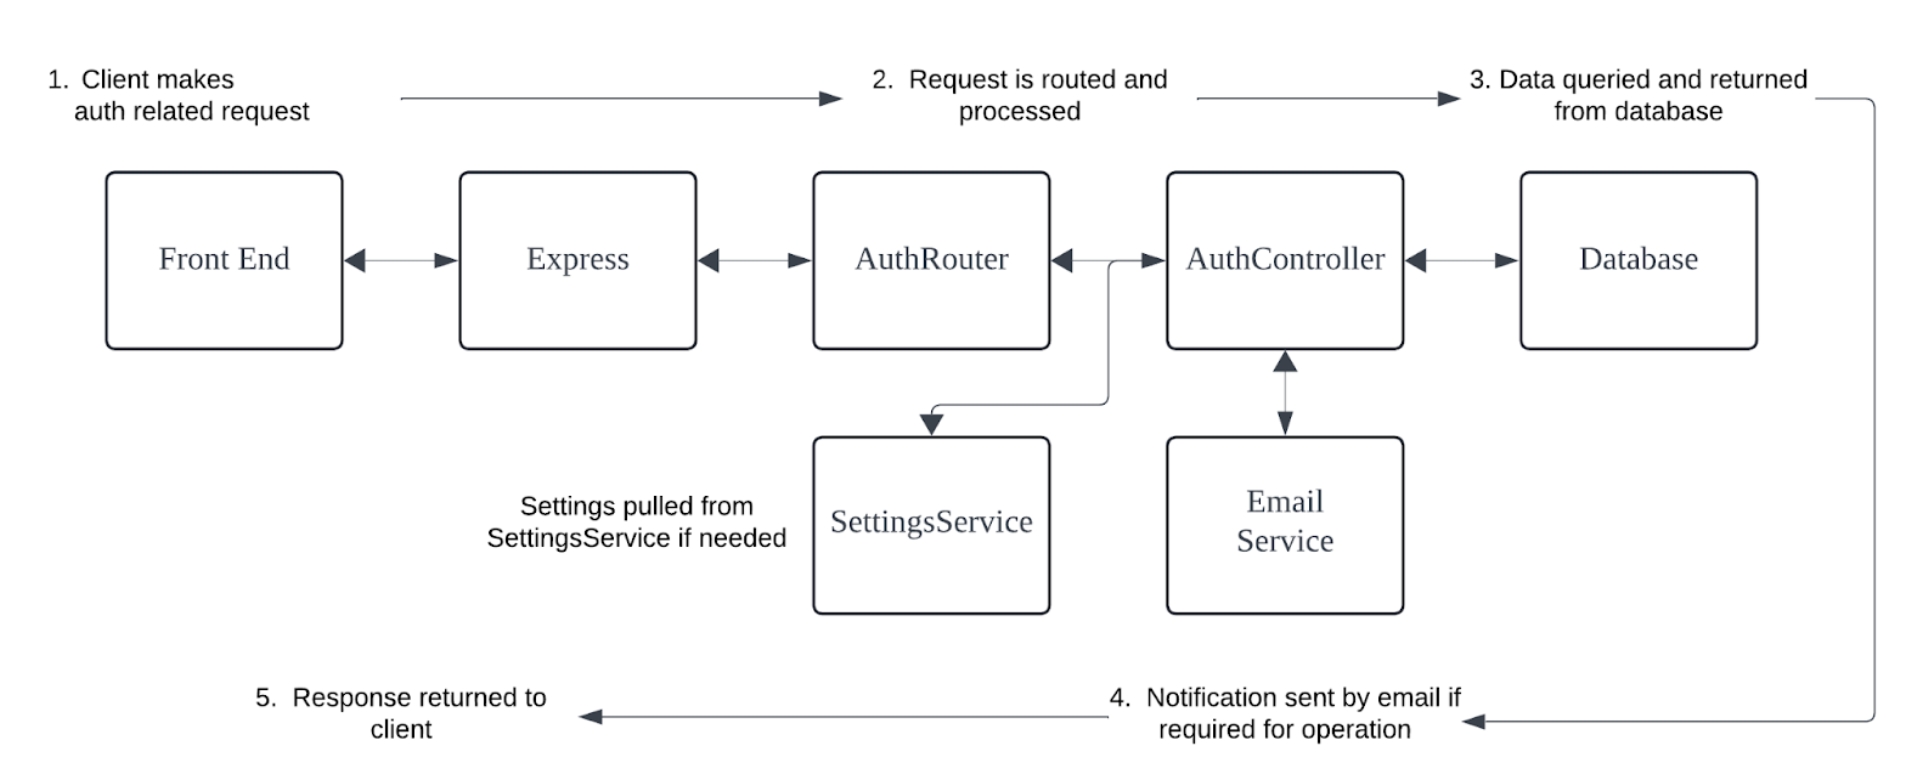
The following diagram describes a typical request to the /auth endpoints.
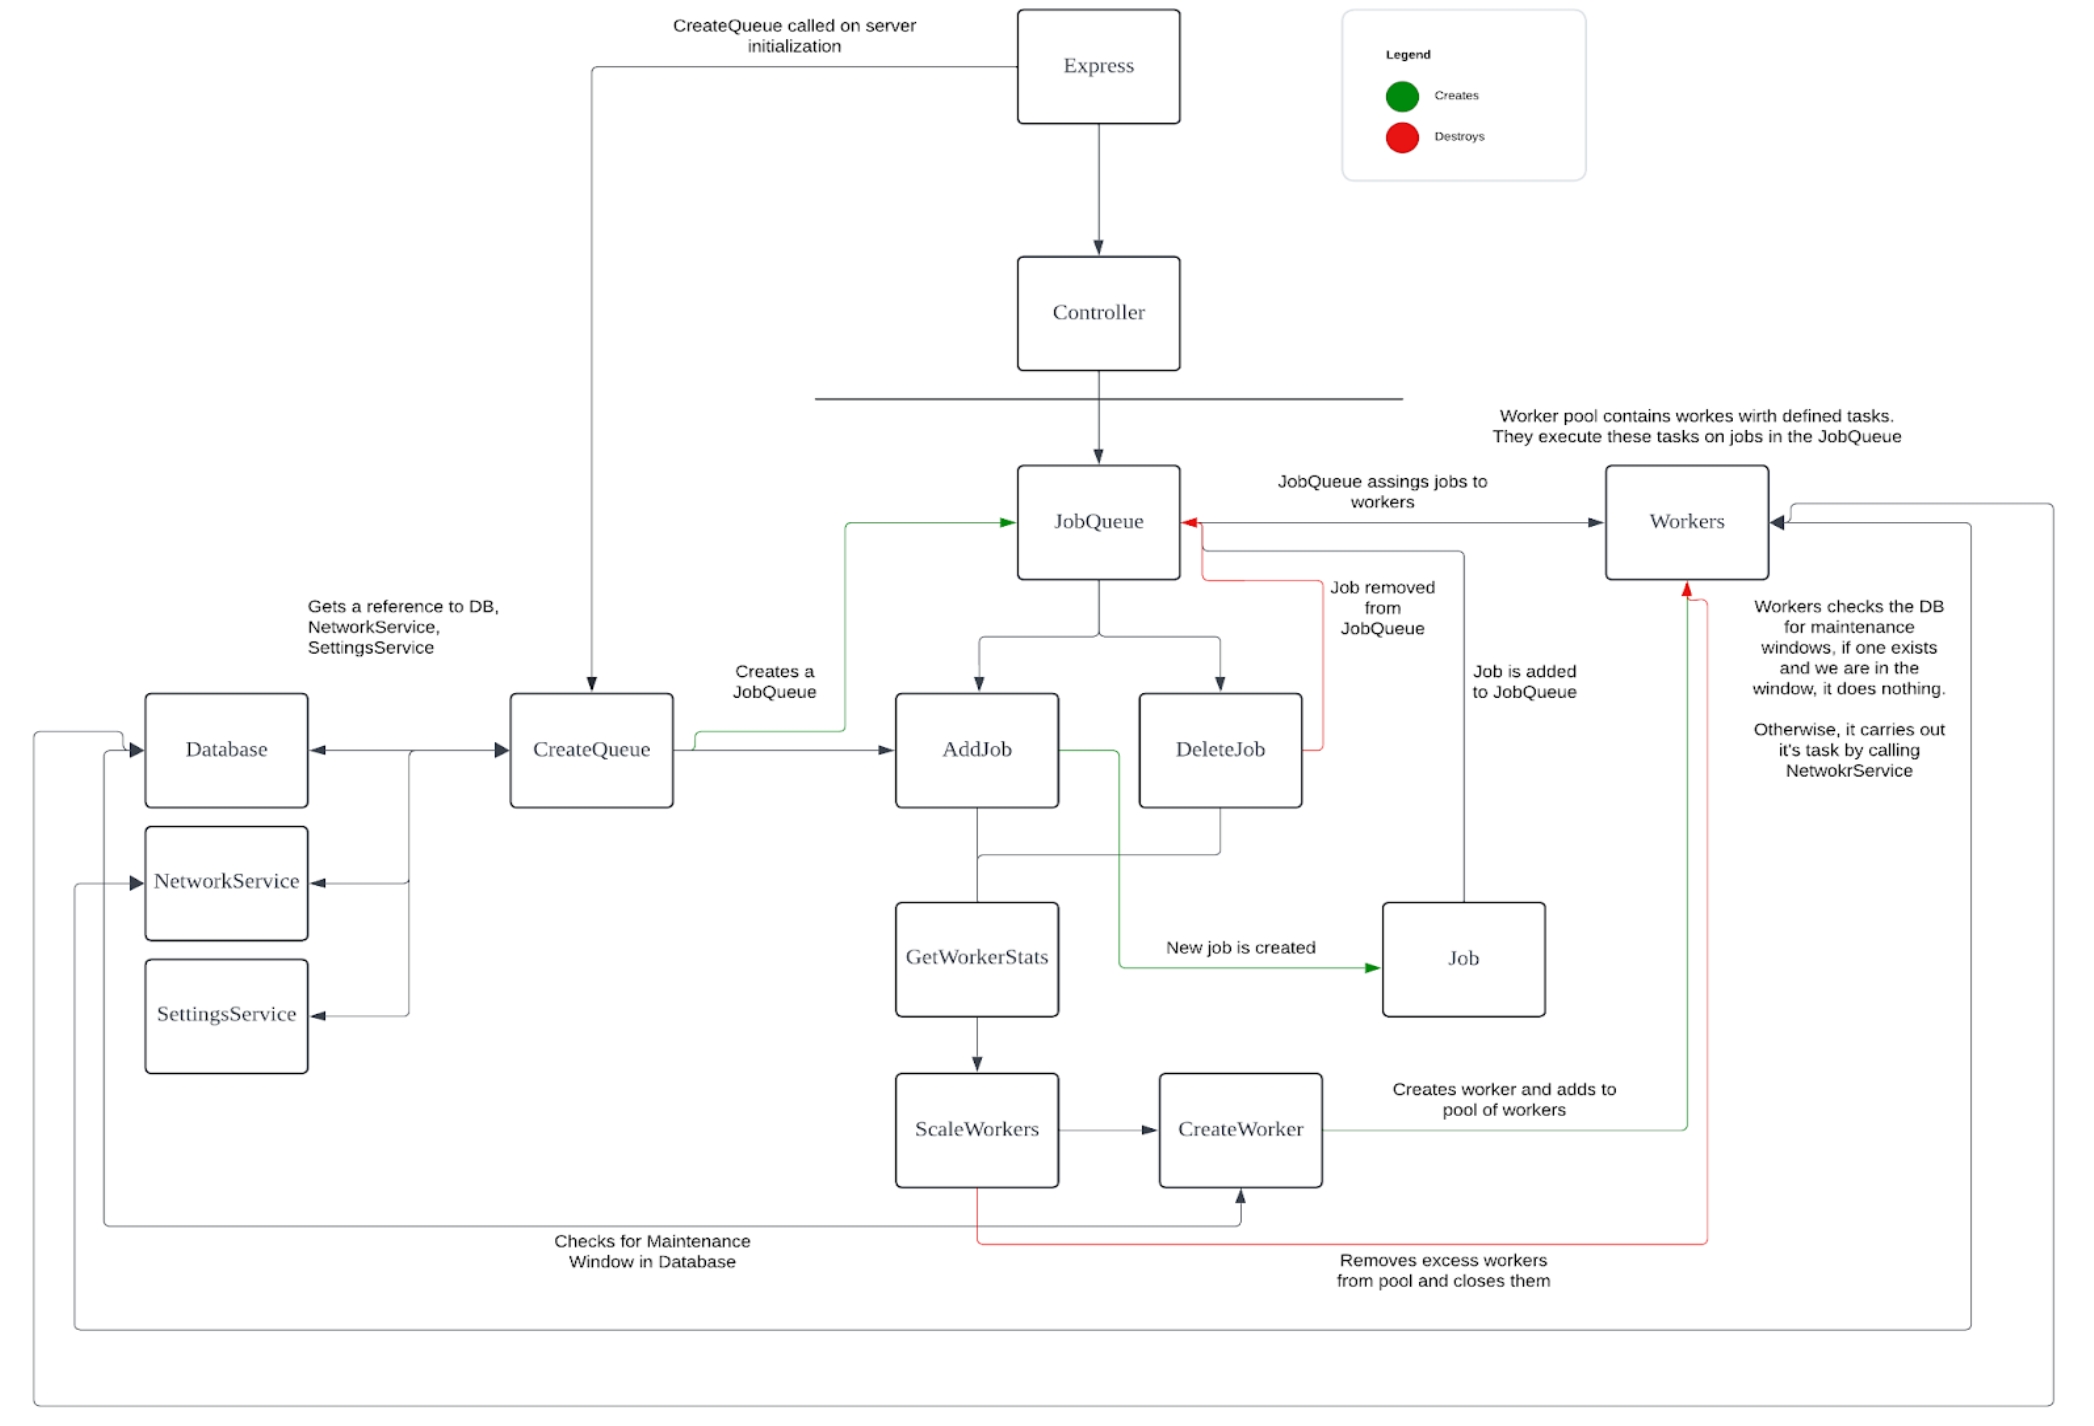
The following diagram describes a typical request to the /monitors endpoints.
The heart of this application is a JobQueue class that wraps a BullMQ Queue.
A Monitor is considered a job, when one is created it is enqueued in the JobQueue.
Jobs are handled by a pool of workers in the JobQueue and their tasks are executed in the order in which they are enqueued.
Workers are scaled up and down based on the jobs/worker ratio as jobs are enqueued and dequeued.
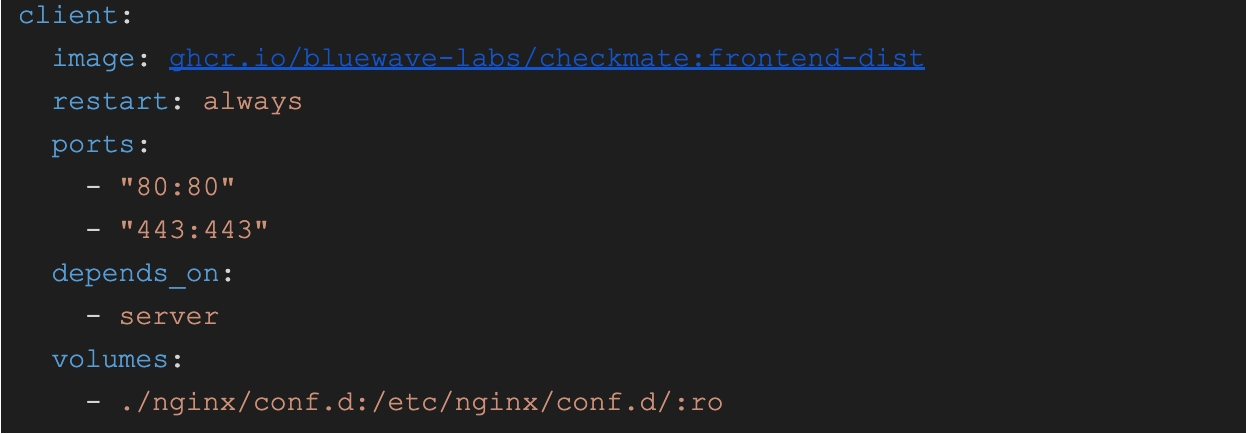
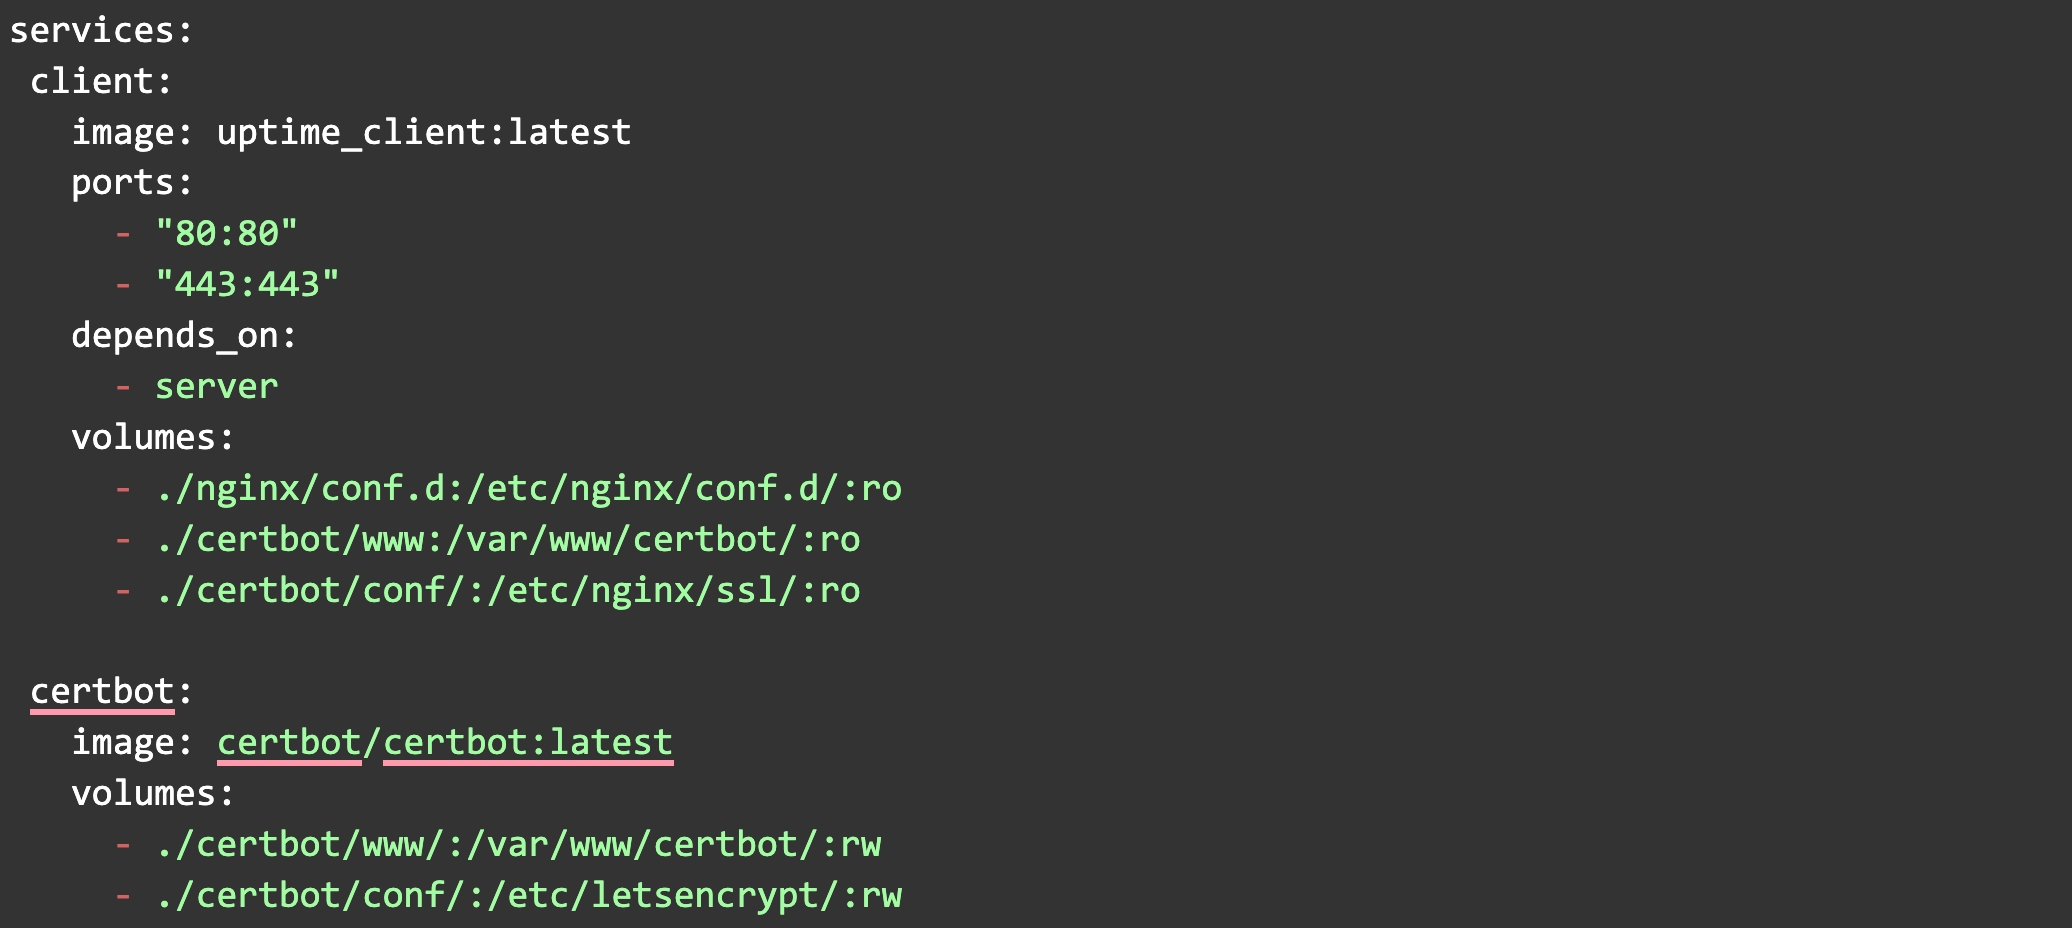
SSL is handled by LetsEncrypt and Certbot. This works by Nginx and Certbot sharing the same volume where the certificates are held. The following snippet from the docker-compose.yaml file shows how this works.
Please see for more information on this setup.
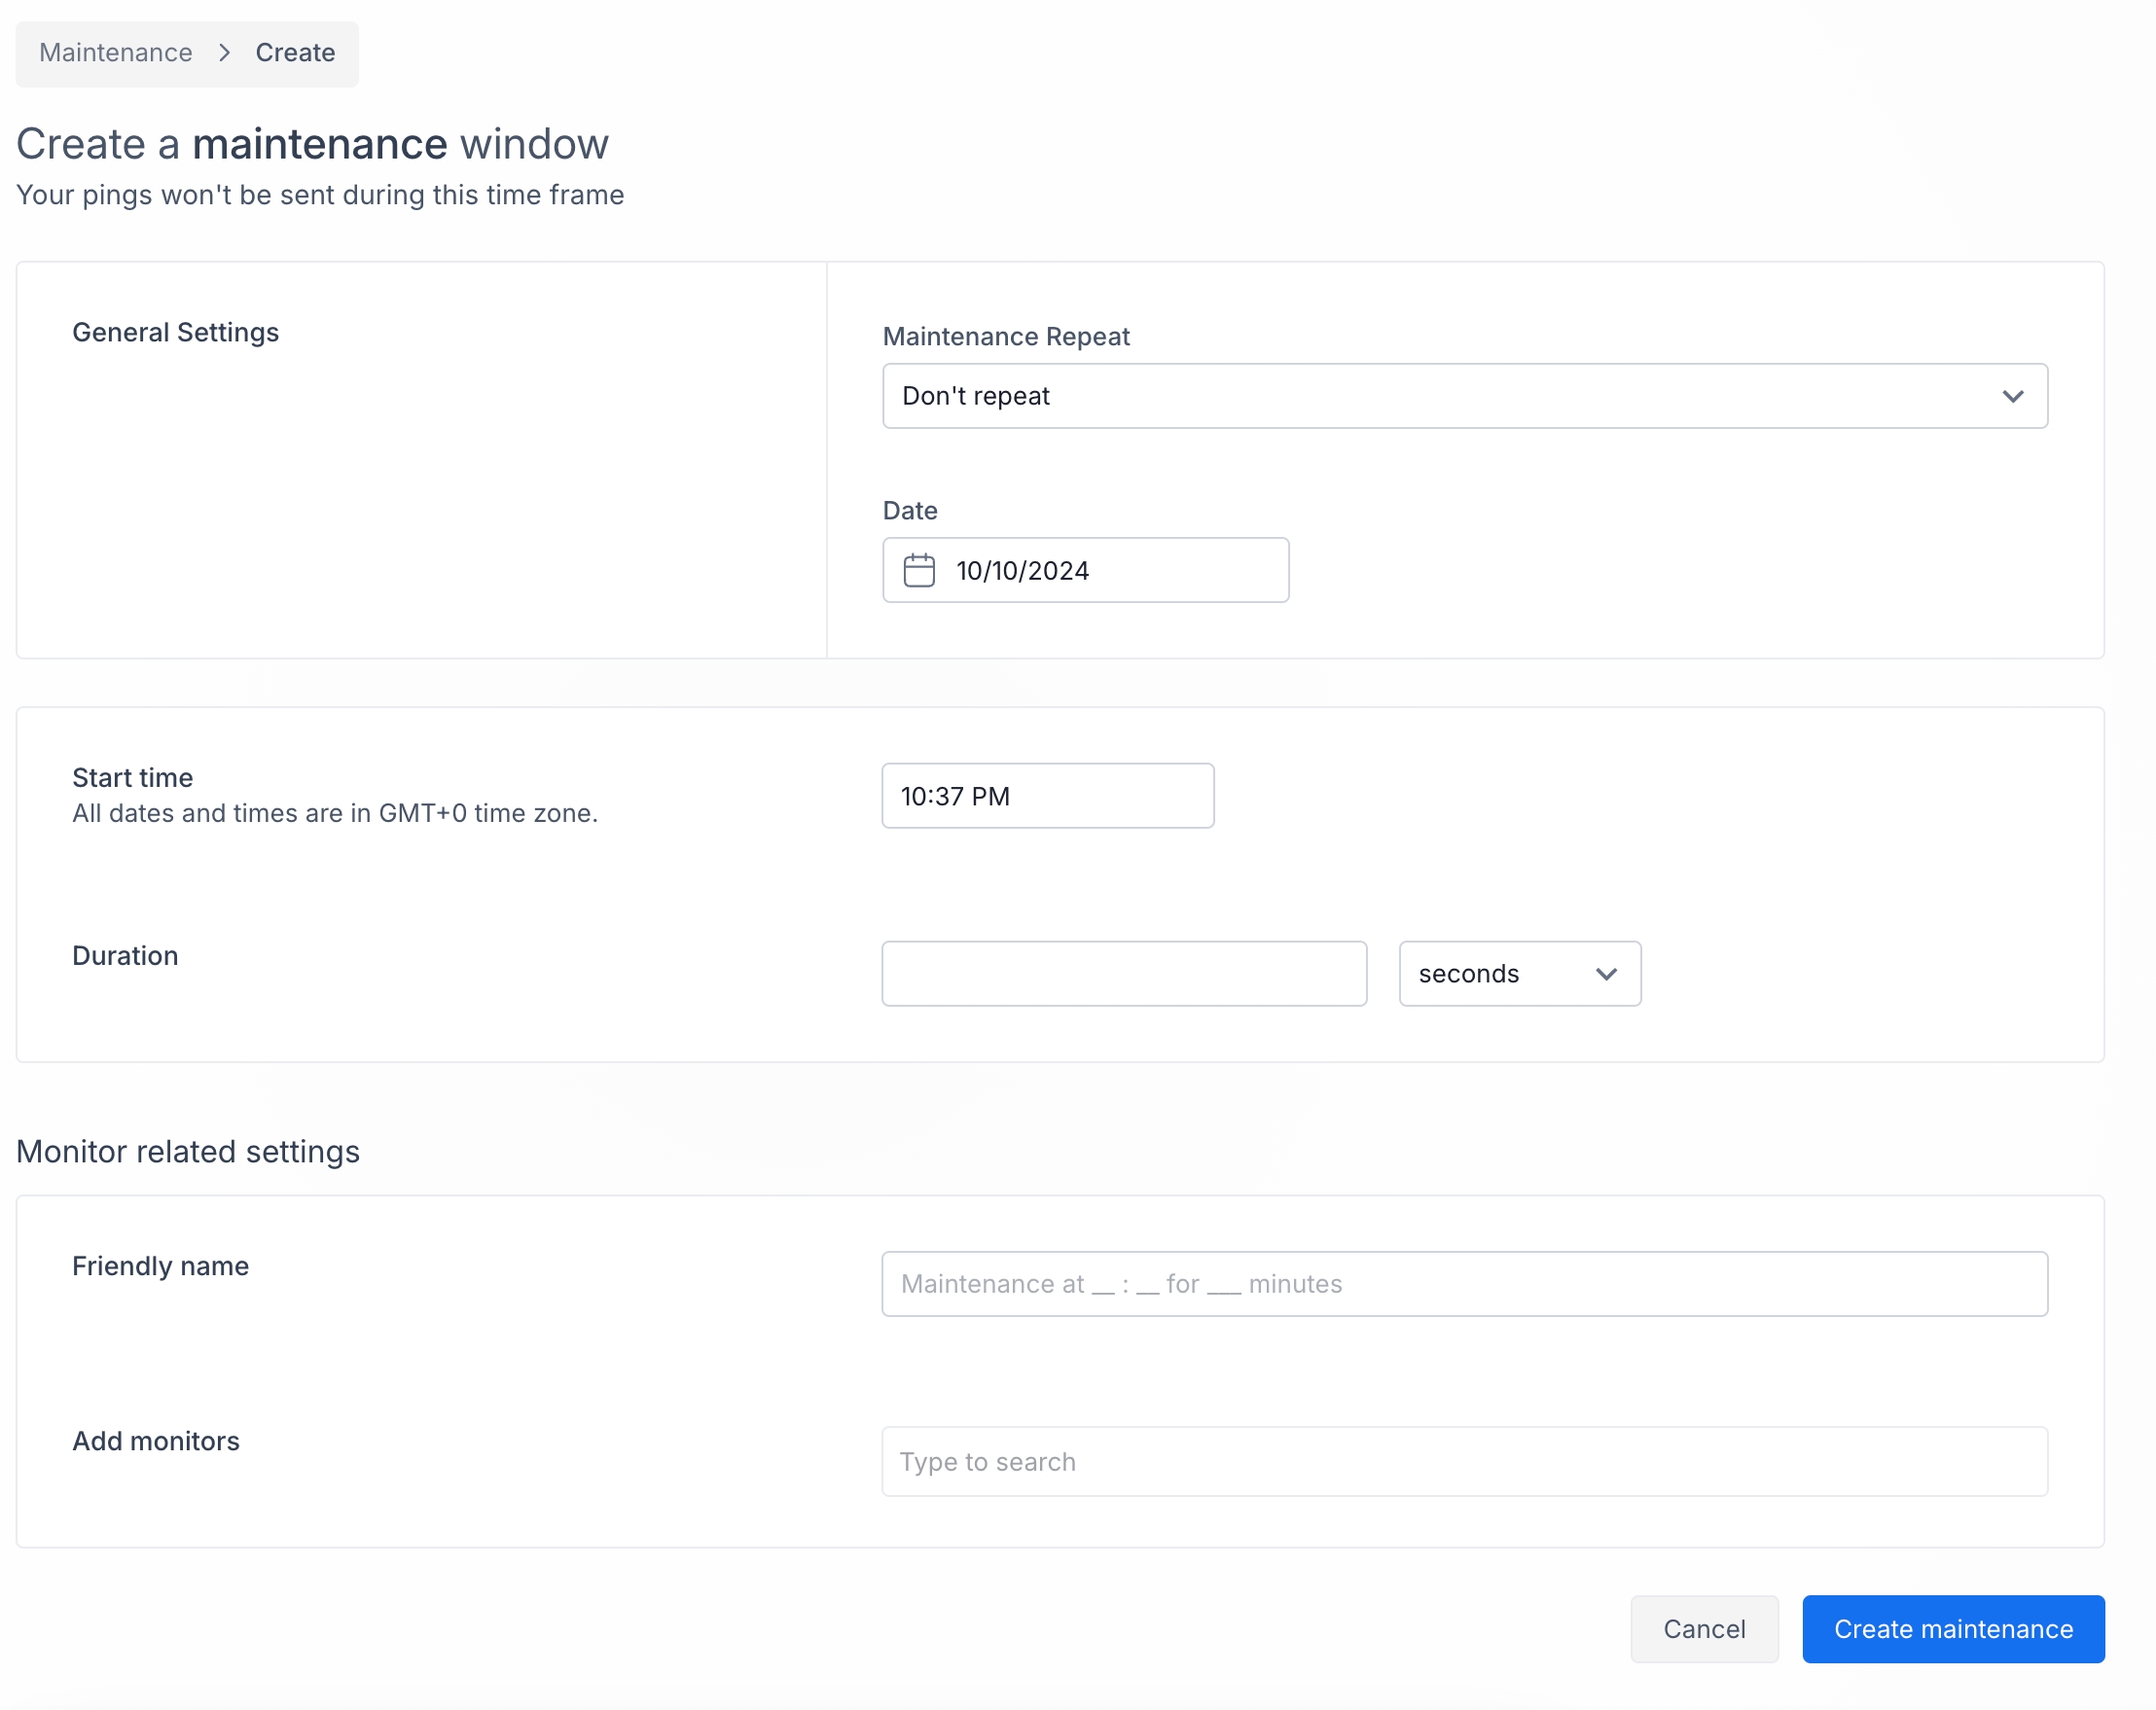
The Maintenance mode allows you to manage and schedule maintenance periods for monitored URLs. During a maintenance window, no pings or HTTP requests are sent to the specified URLs, preventing downtime alerts during scheduled maintenance activities.
When you click the "Create Maintenance Window" button, you will see a page similar to this:
Here's how to set up a new maintenance window:
General settings:
Maintenance repeat: Select how often the maintenance window should repeat (e.g., don't repeat, daily, weekly).
Date: Select the date the maintenance window should start.
Start time: Set the time of day the window begins.
Duration: Specify how long the maintenance window should last (in seconds, minutes, or hours).
Monitor related settings:
Friendly Name: Provide a descriptive name for the maintenance window (e.g., "Maintenance at 10:37 PM for 30 minutes").
Add Monitors: Select the specific monitors (URLs) for which this maintenance window will apply by typing and selecting from the list.
Once all fields are filled, click Create maintenance to save the new window.
To edit an existing window, click the gear icon under Actions in the table view.
Update the required fields and save your changes.
Before you are going to dive deep into the code, check this great breakdown of Checkmate codebase and internal structure for serious developers.
We generally follow the gitflow workflow model. If you’re not familiar with it, the general steps are
Create a feature branch in your local repository and make your changes.
Push your branch to the remote repository on Github.
Open a pull request.
The rest of the team will review the pull request and either approve or request changes.
If changes are requested, make changes and push.
Project maintainer will merge the branch, closing the pull request and deleting the remote branch.
If you are inexperienced with Git or need a refresher please visit our to help get up to speed. If you’d like to go further in depth, this is a good resource.\
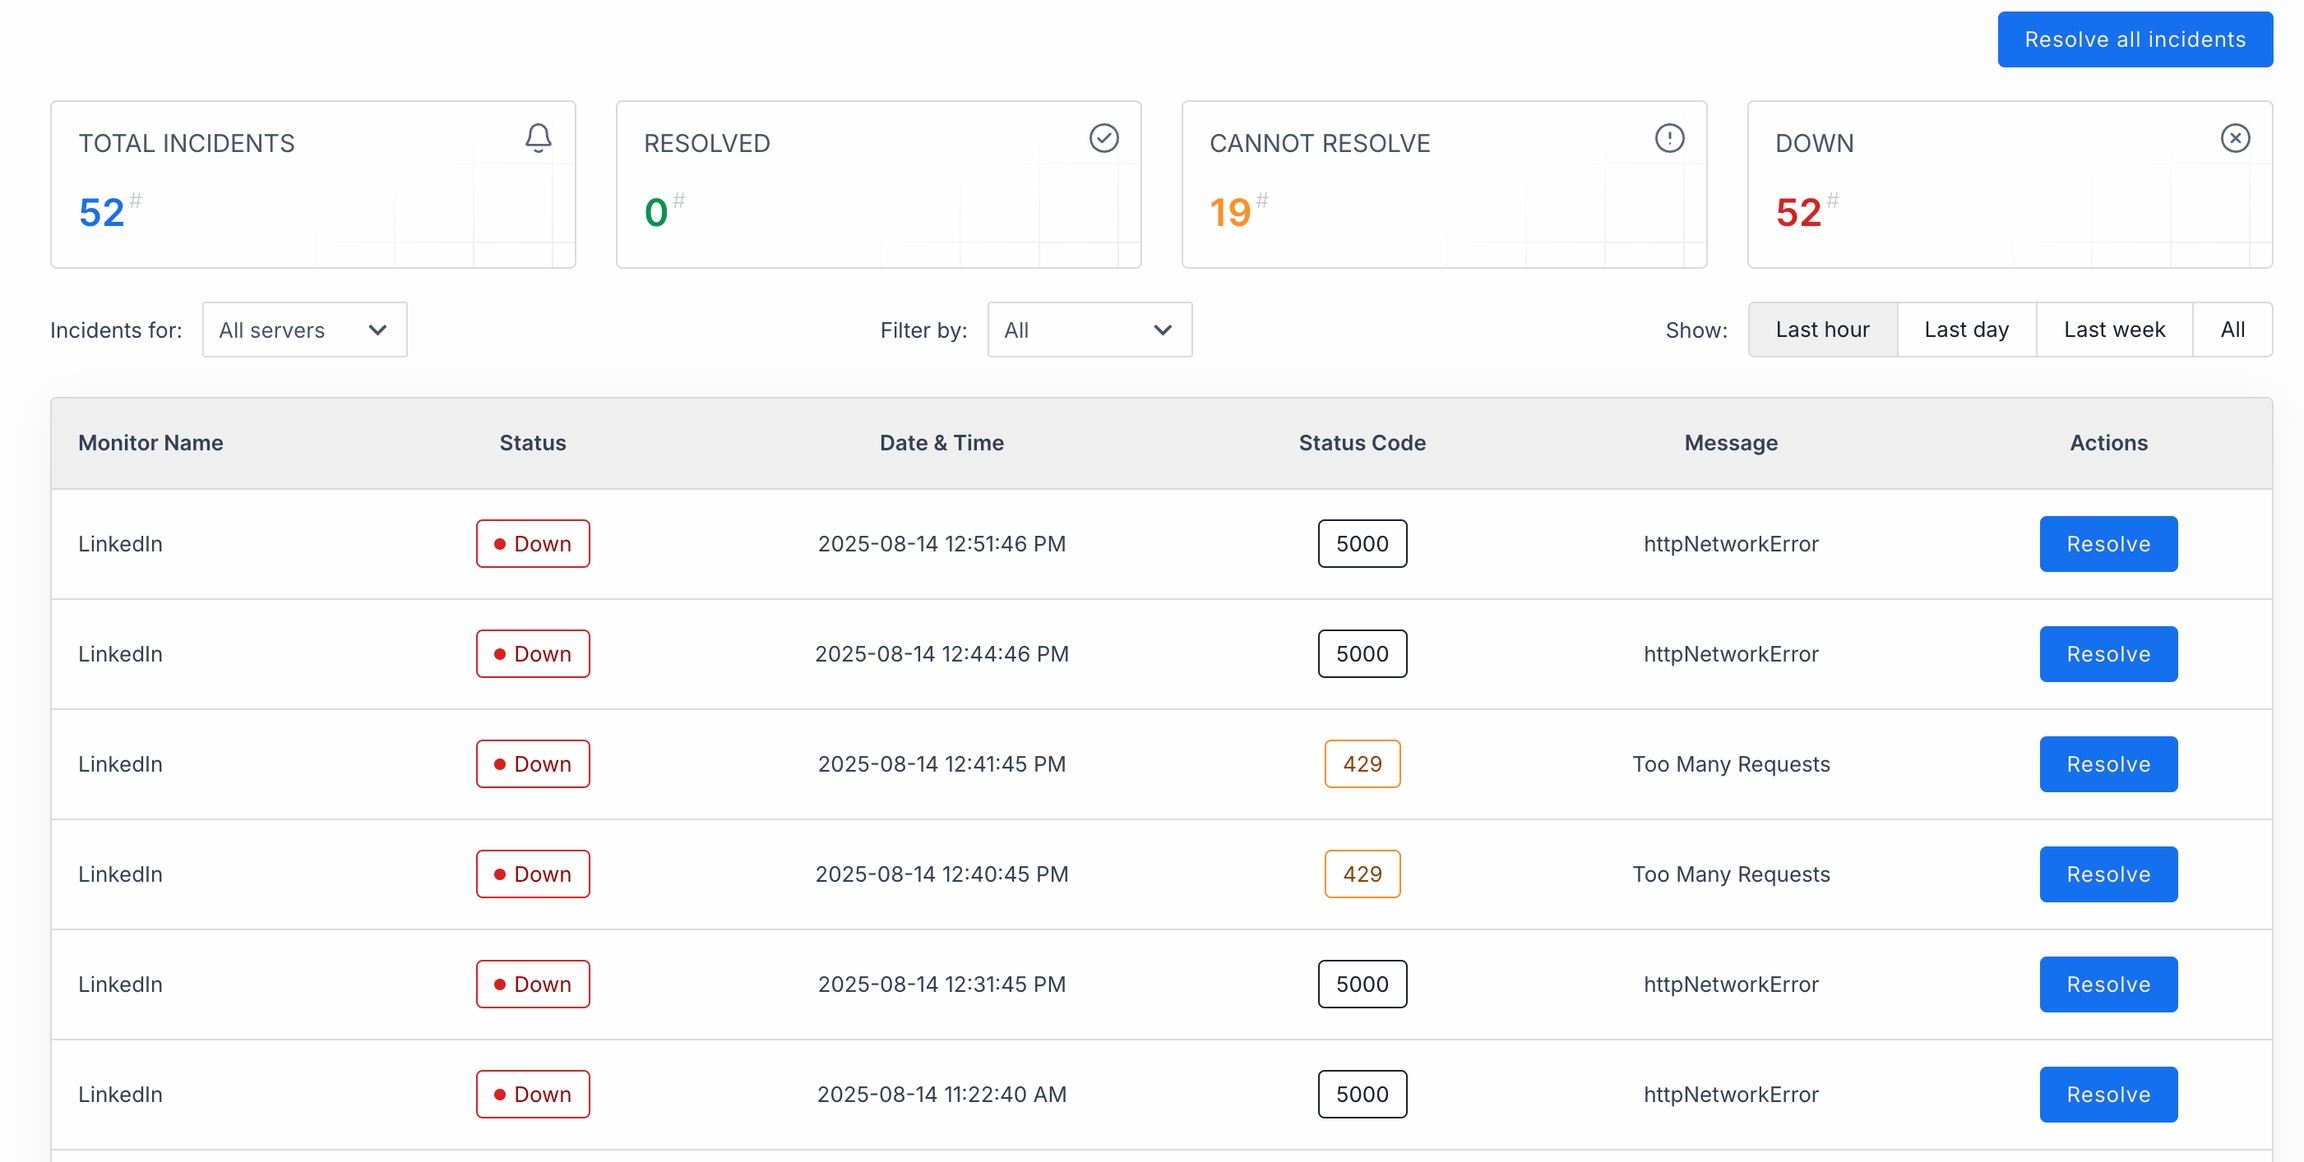
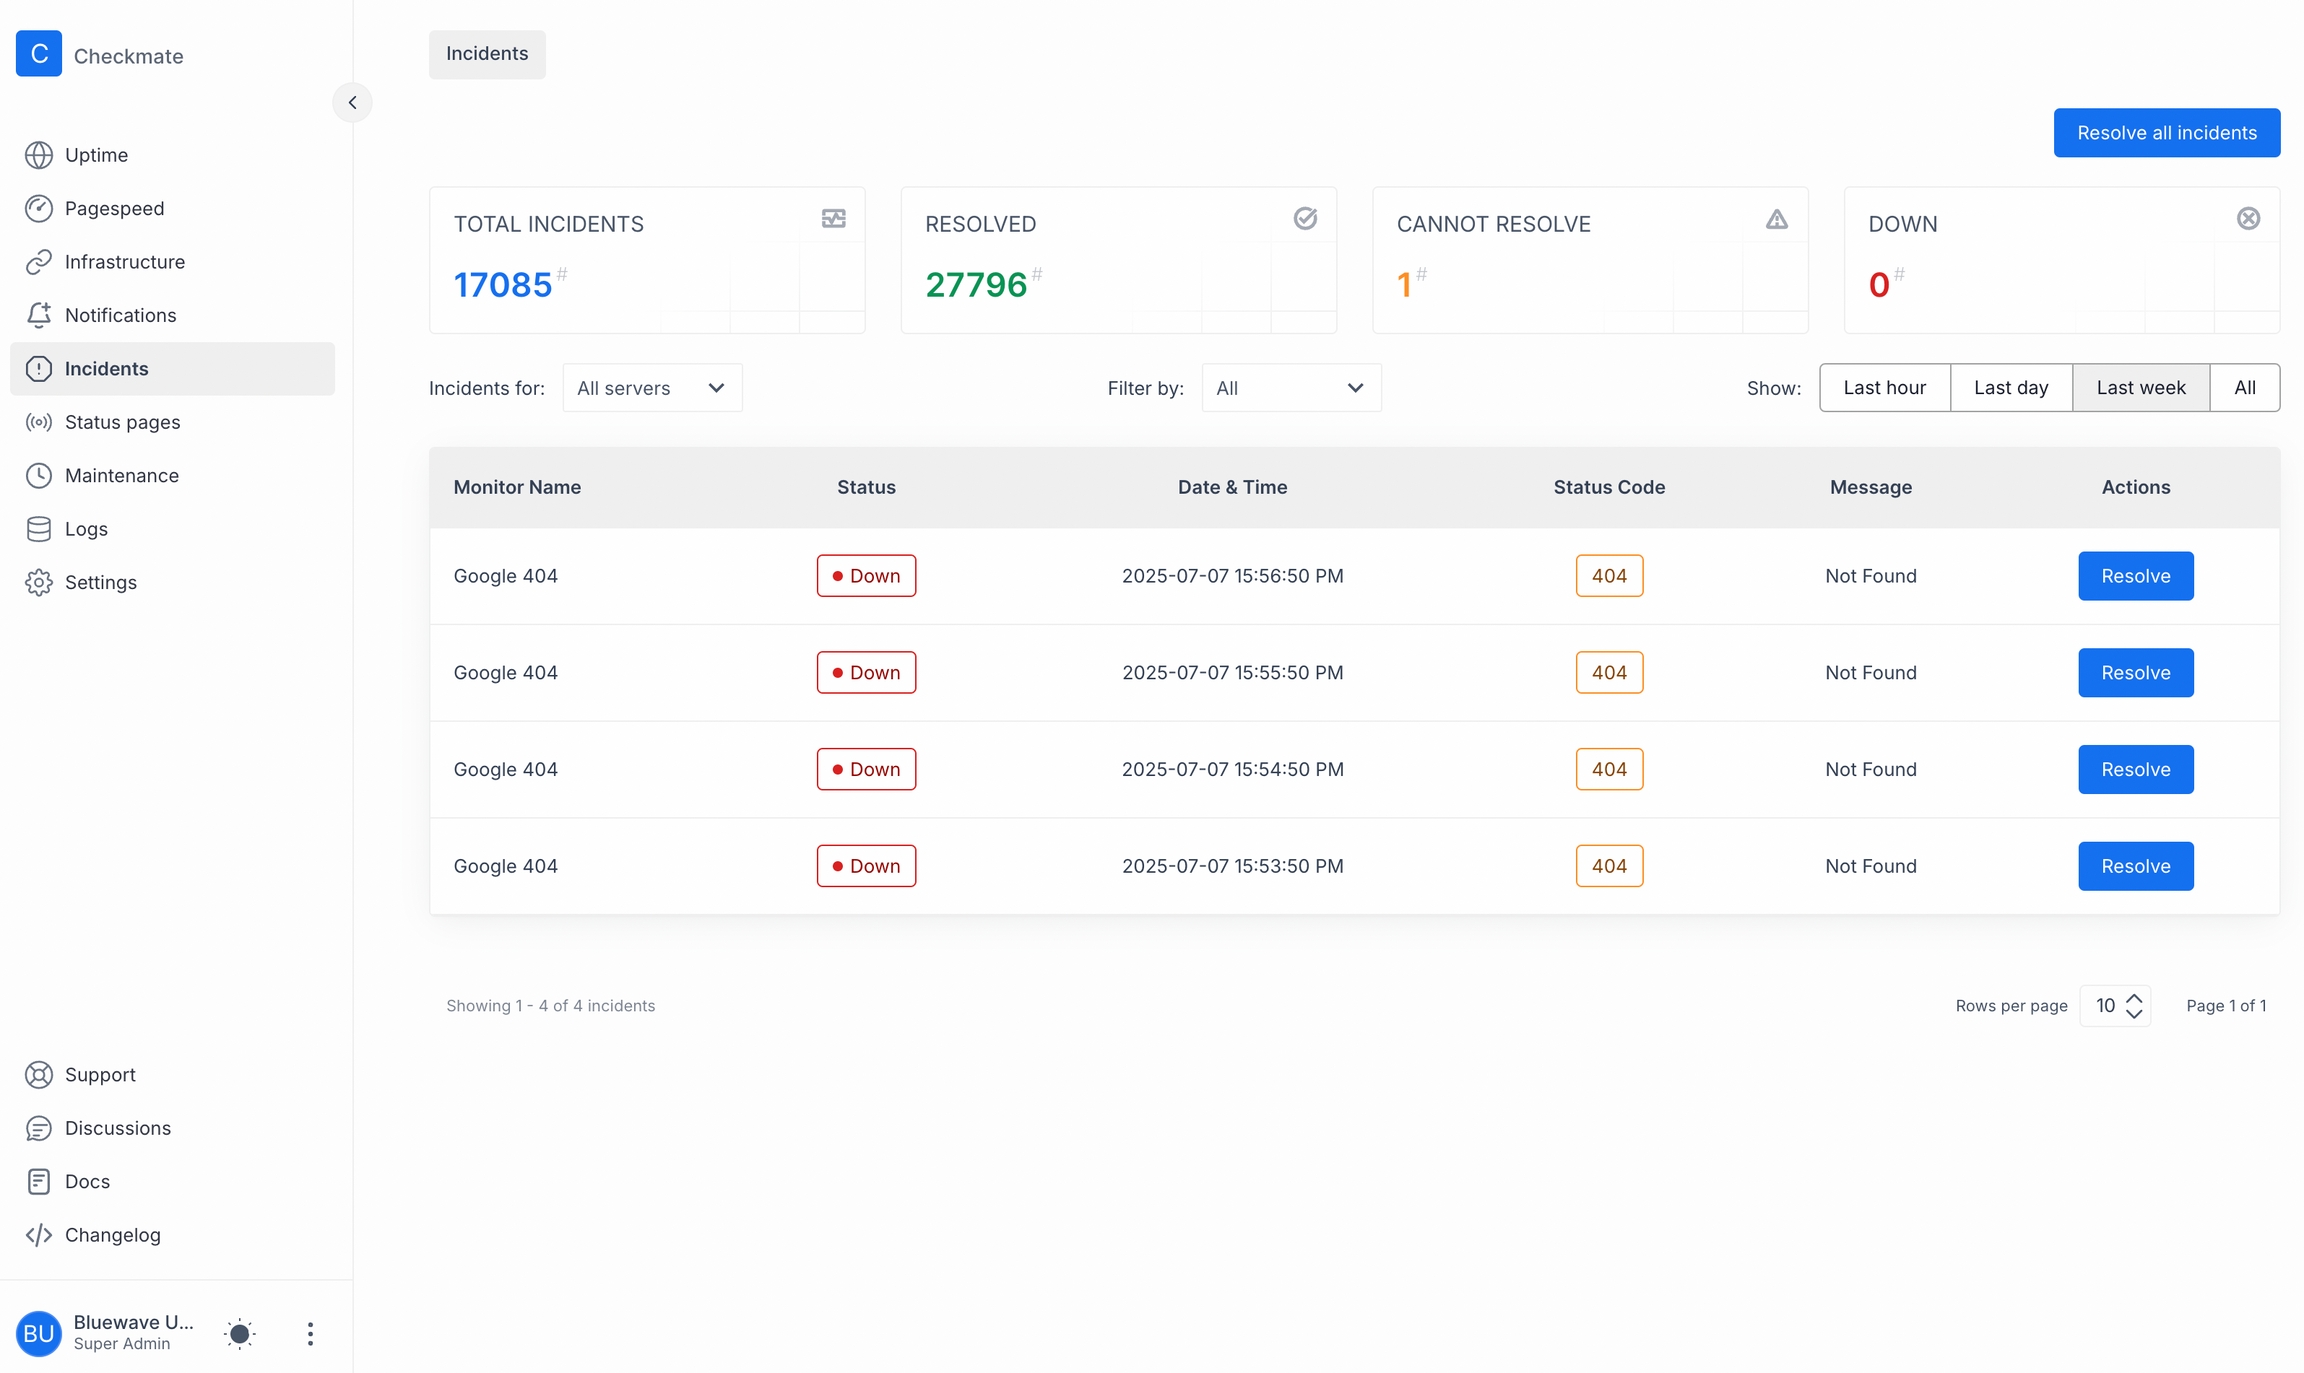
This page provides a comprehensive overview of all incidents across the servers you monitor. The incidents are displayed in a detailed table format, allowing you to quickly assess the status and details of each incident.
Incidents page includes a table where Monitor name, Status (down or cannot resolve), date and time of the incident, status code and corresponding message is shown.
By default, the page shows all incidents from all servers. There is also a dropdown button above the table where you can select a server name.
The incidents table includes the following columns:
This is a brief overview of the project structure. If you are a serious developer and would like to learn how Checkmate works in detail, please check :)
The Uptime Manager product uses the MERN stack, which is to say that the project uses:
React on the frontend via Vite
Company name Enter your company’s name as you want it to appear on the status page.
Your status page address
Define the subdomain or unique ID (for example, 975737) that users will visit.
Display timezone Pick the timezone (for example, America/Toronto) in which all timestamps on the page will be shown.
Logo upload Click Click to upload or drag and drop a JPG, JPEG, or PNG (max 3 MB) to set your logo. This will be shown on the status page. We suggest that you use a square logo.
Primary color
Enter or pick a hex color (for example, #4169E1) to match your brand.
Click Save at the bottom to apply any changes. Then, go to Contents section.
This is where you manage the list of servers you monitor.
Add servers Use the search box to find and add any server you’re monitoring.
Reorder servers Drag and drop entries to set the display order for your visitors.
Toggle extra display options on your status page:
Show charts Enable to display historical uptime graphs.
Show uptime percentage Enable to display the overall uptime percentage.
Show "Administrator? Login Here" link on the status page
Normally the admin login link is not shown on the status page. You can enable it here.
Don’t forget to click Save after you make updates.
MongoDB for data with Mongoose for data access
The project uses the Material UI Components (MUI) which allows us to build with a minimum of fuss. The library is highly customisable and the project makes heavy use of the Theme concept and follows MUI’s paradigm to avoid writing excessive CSS. The overriding goal on the frontend is to write maintainable and scalable code. If you find yourself writing lots of CSS to customize a component or are having to set a value often like font size or color you probably should be using the theme. When making changes to the frontend please always keep future developers in mind. Will they know how to make changes to your code? Is your code modular? If a dev makes changes elsewhere in the app will your component be affected? If the team makes a theme change like font size or primary color will your component be updated as well?
The back end of this project is not especially complex and is built around Express. The back end is a RESTful API and the documentation can be found here.
The application consists of several main conceptual models:
User
Monitor
Check
Notification
There are several supporting models as well.
AppSettings
InviteToken
Team
All requests are based around these models and manipulation of their data. In general the models interact in this fashion:
A User has many Monitors
A Monitor has many Checks
A Monitor has many Notifications
A User can create a Monitor. Monitors are enqueued in the JobQueue, and their target URLs are queried when they are dequeued. When the query is complete, a Check is created that records information about the request.
A User may attach a Notification to their Monitor, if the Monitor’s status changes then the user will be notified by the method specified in the Notification
Monitor Name: The name of the monitor that detected the incident.
Status: The current status of the incident (e.g., Active, Resolved).
Date & Time: The timestamp when the incident was first detected.
Status Code: The HTTP status code returned during the incident.
Message: Additional information or error message related to the incident.
The “Resolve all incidents” button at the top will mark every incident in your current view as resolved in one go. This clears them from the active list and updates your resolved-count.
Each little “Resolve” button on the right does the same thing, but just for that single incident: acknowledging that you’ve handled it and dropping it off the active incidents table.
Infrastructure monitor is used to get information (hardware and network) from a remove Linux, Windows or MacOS machine.
This is the only feature of Checkmate that retrieves data from remote servers using Checkmate's server agent, Capture.
In order to check a remote server's CPU, disk, memory and disk, you need to install Checkmate agent first. Please read to install Capture.
Note that Capture agent is not installed on the Checkmate server by default.
For an available list of platforms and what kind of data Capture retrieves,
Navigate to the Infrastructure section in Checkmate and click the Create button to access the setup form for creating a new infrastructure monitor.
In this section, you'll define the server to monitor and provide essential credentials.
Server URL:
Enter the URL of the host you want to monitor. Ensure the server is running the Checkmate Monitoring Agent to start data collection.
Display name (optional):
Add a friendly name for the server to make it easier to identify in your monitoring dashboard.
Authorization secret:
Enter the secret key required to authenticate with the monitoring agent on the server.
To receive notifications when an incident occurs:
Check the box labeled Notify via email.
Enter the email address where notifications should be sent.
Set specific thresholds for server performance metrics. When these thresholds are exceeded, you’ll receive notifications.
Check the metrics you want to monitor:
CPU: Specify a percentage threshold (e.g., 80%) for CPU usage.
Memory: Specify a percentage threshold (e.g., 70%) for memory usage.
Disk: Specify a percentage threshold (e.g., 90%) for disk usage.
Temperature: Specify a temperature threshold (e.g., 75°C).
Adjust the thresholds to match your monitoring needs.
Define how frequently the infrastructure monitor checks the server for updates:
Use the Check Frequency dropdown menu to select an interval (e.g., every 15 seconds).
Once all settings are configured, click the Create Infrastructure Monitor button at the bottom of the page to finalize the setup.
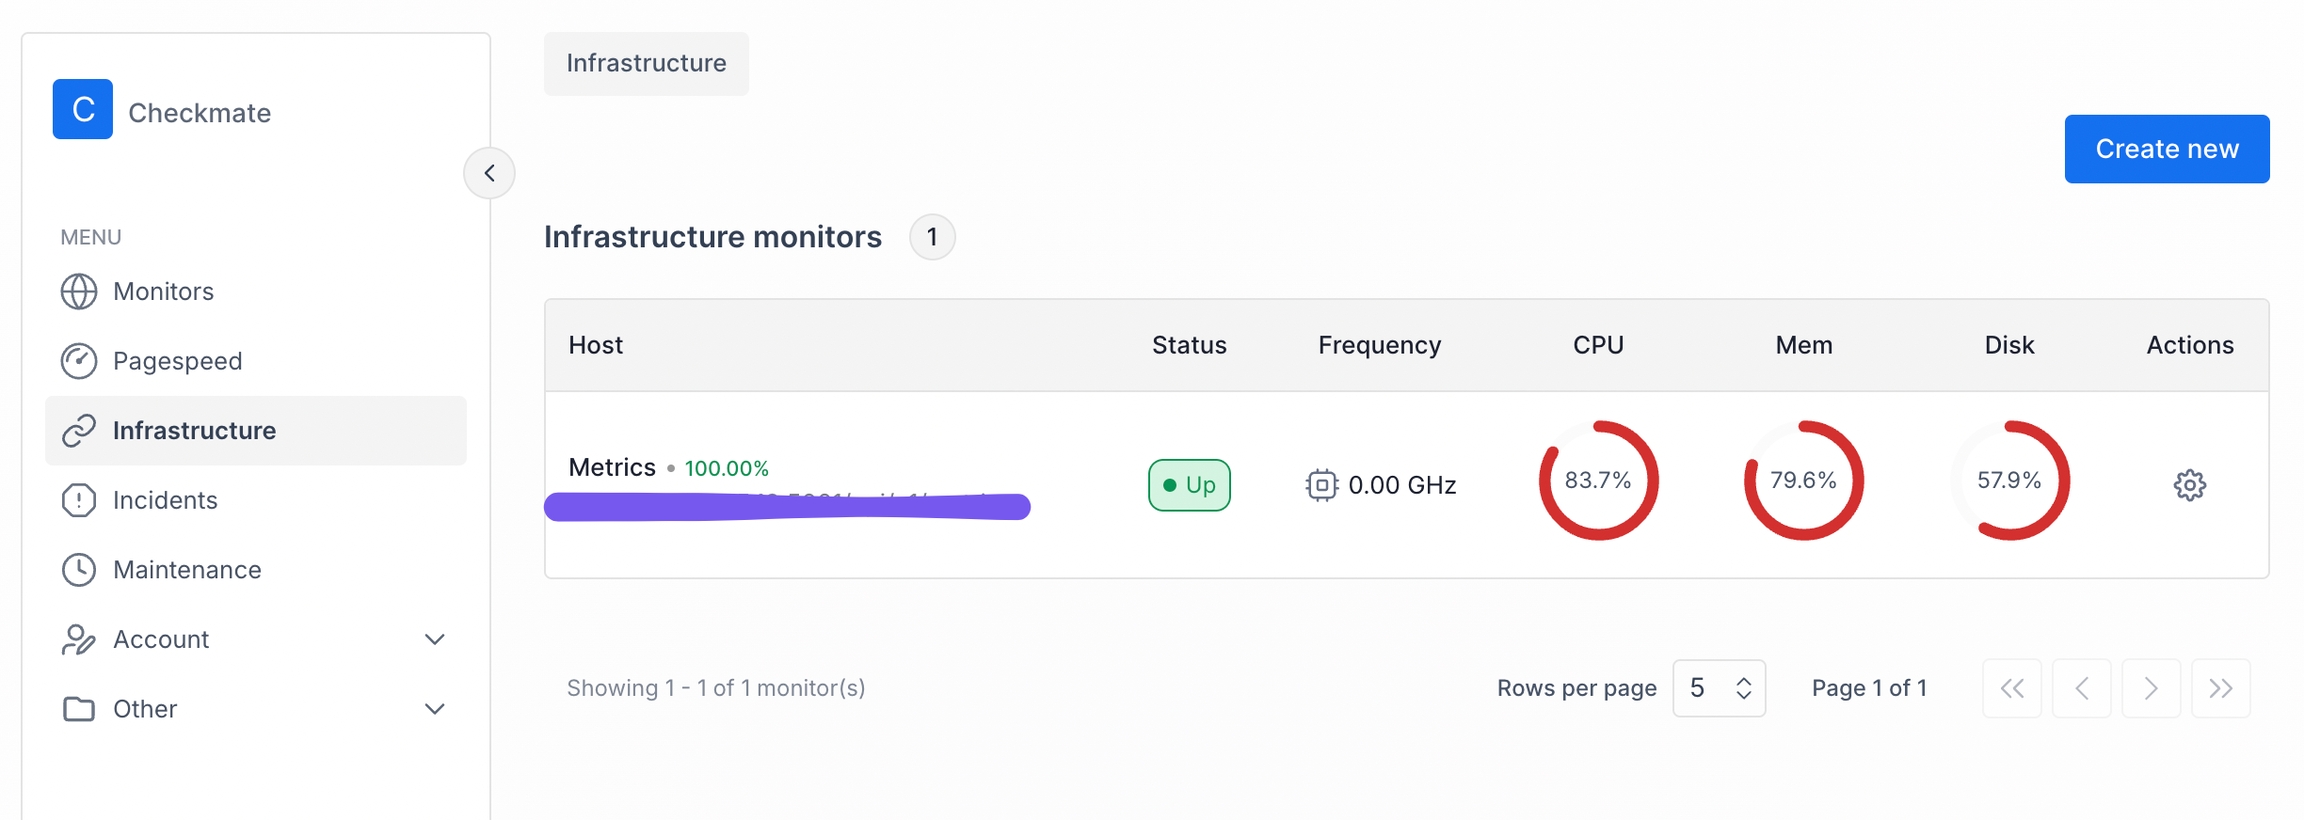
Your new infrastructure monitor will now appear in the monitoring dashboard, and it will actively track the server based on your selected preferences.
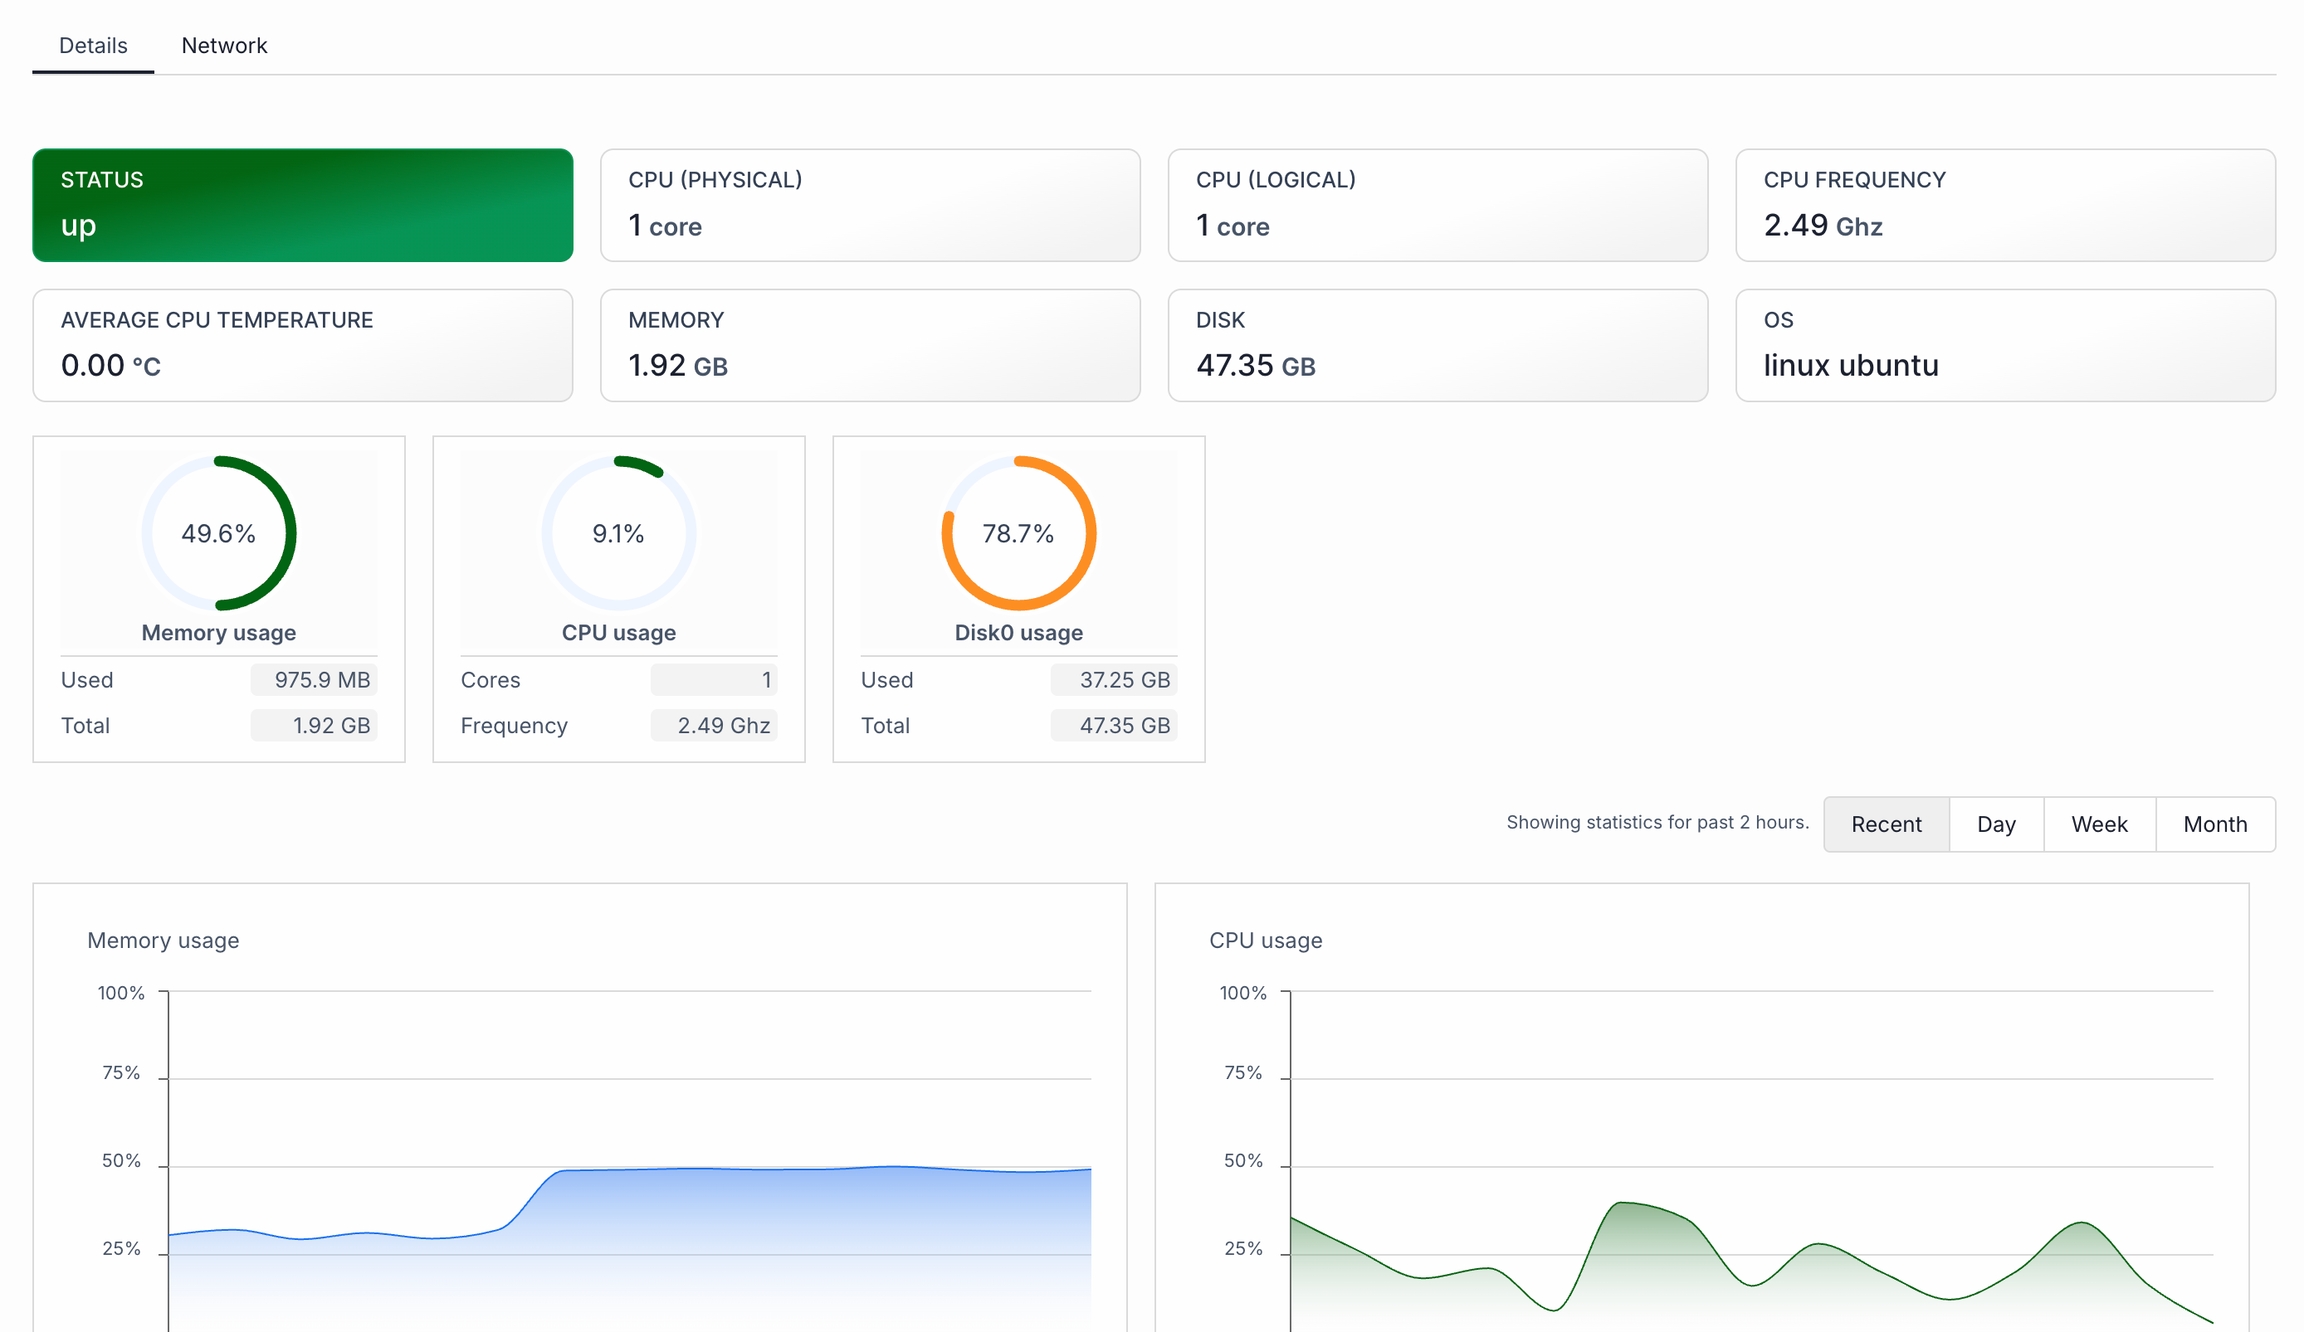
Note that there will be 2 different tabs here - Details and Network. Under Details, you'll see CPU, RAM, memory, disk instant info in gauges and also a historical values. Under Network, all details retrieved from your network adapters will be shown.
This user guide helps new users navigate and understand the Checkmate dashboard layout and functionality.
Checkmate is an open-source server monitoring tool designed to track the uptime, downtime, and performance of servers, websites, or web applications.
It provides real-time alerts, status updates, and detailed response time metrics.
The sidebar on the left contains the following sections:
Uptime: Shows the uptime of your monitors
Pagespeed: Shows your web page speed and performance
Infrastructure: Gets RAM, CPU, disk etc data from your servers and shows on a UI.
Incidents: A section where alerts and incidents regarding the monitored services are logged. This helps users investigate issues and track downtime history.
User info section
At the bottom of the sidebar, you’ll see the current logged-in user alongside with the role. When you click on the hamburger menu, you'll see sections like Profile, Password, Team and Log out.
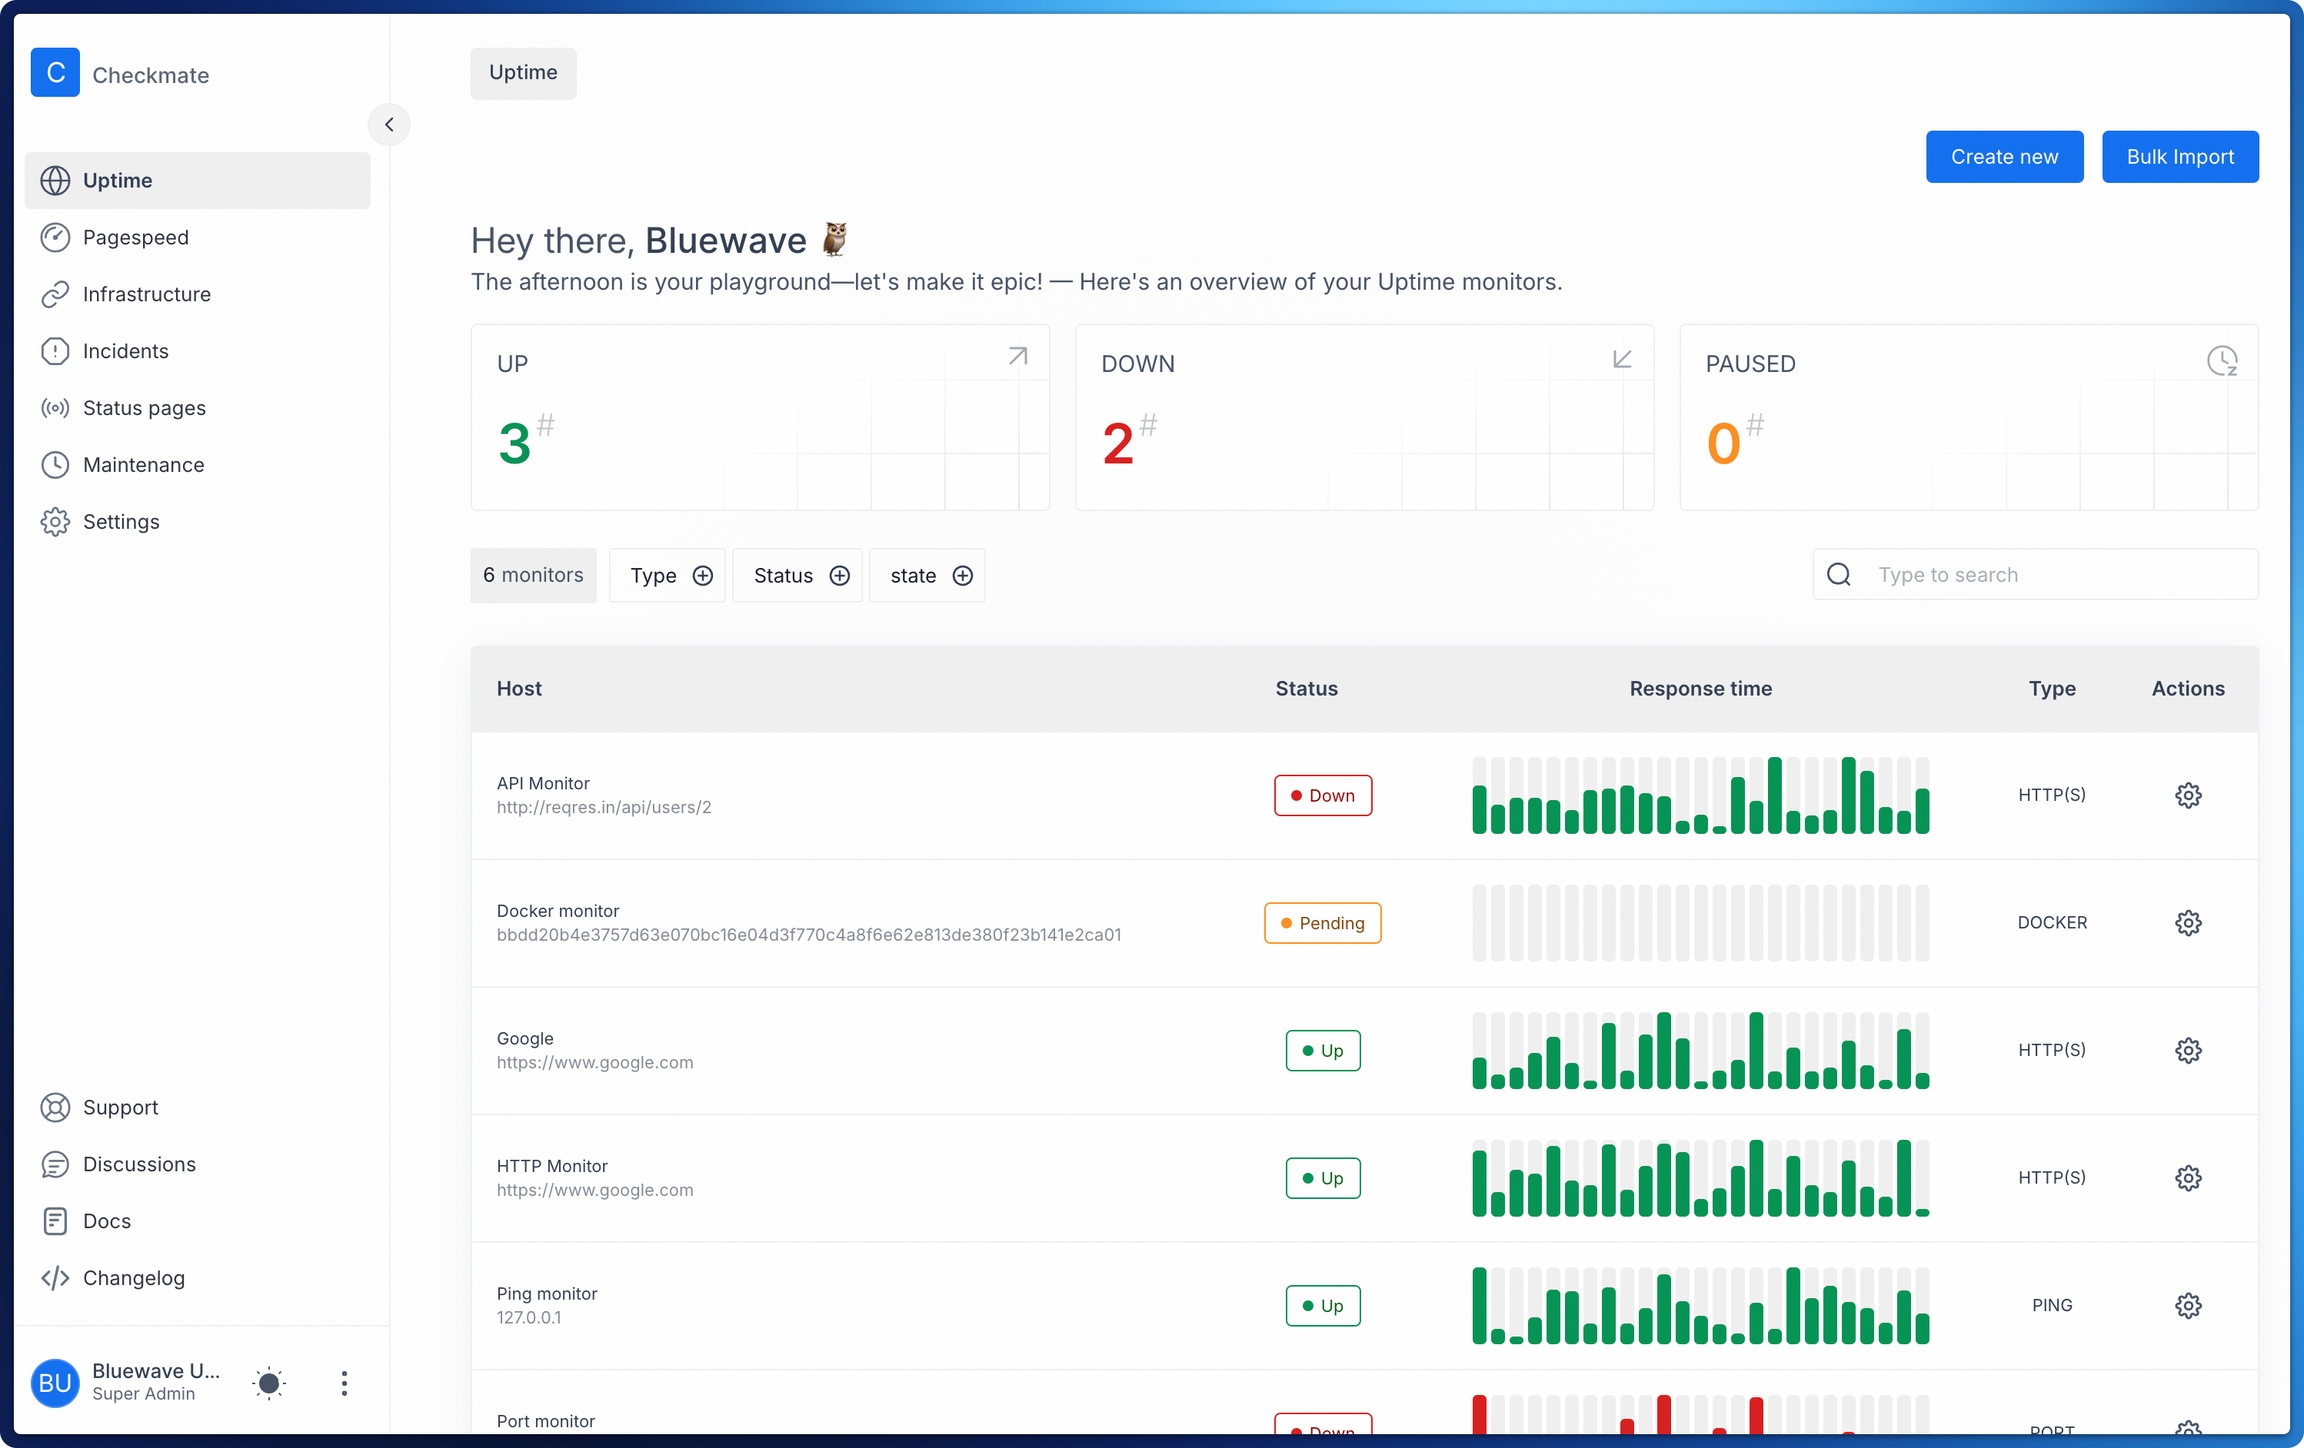
The main section of the dashboard displays an overview of the monitored services, including their current status and key performance indicators.
The dashboard offers a summary of your uptime monitors:
Up: The number of monitored services that are currently operational.
Down: The number of monitored services that are currently experiencing issues.
Paused: The number of services that have their monitoring paused.
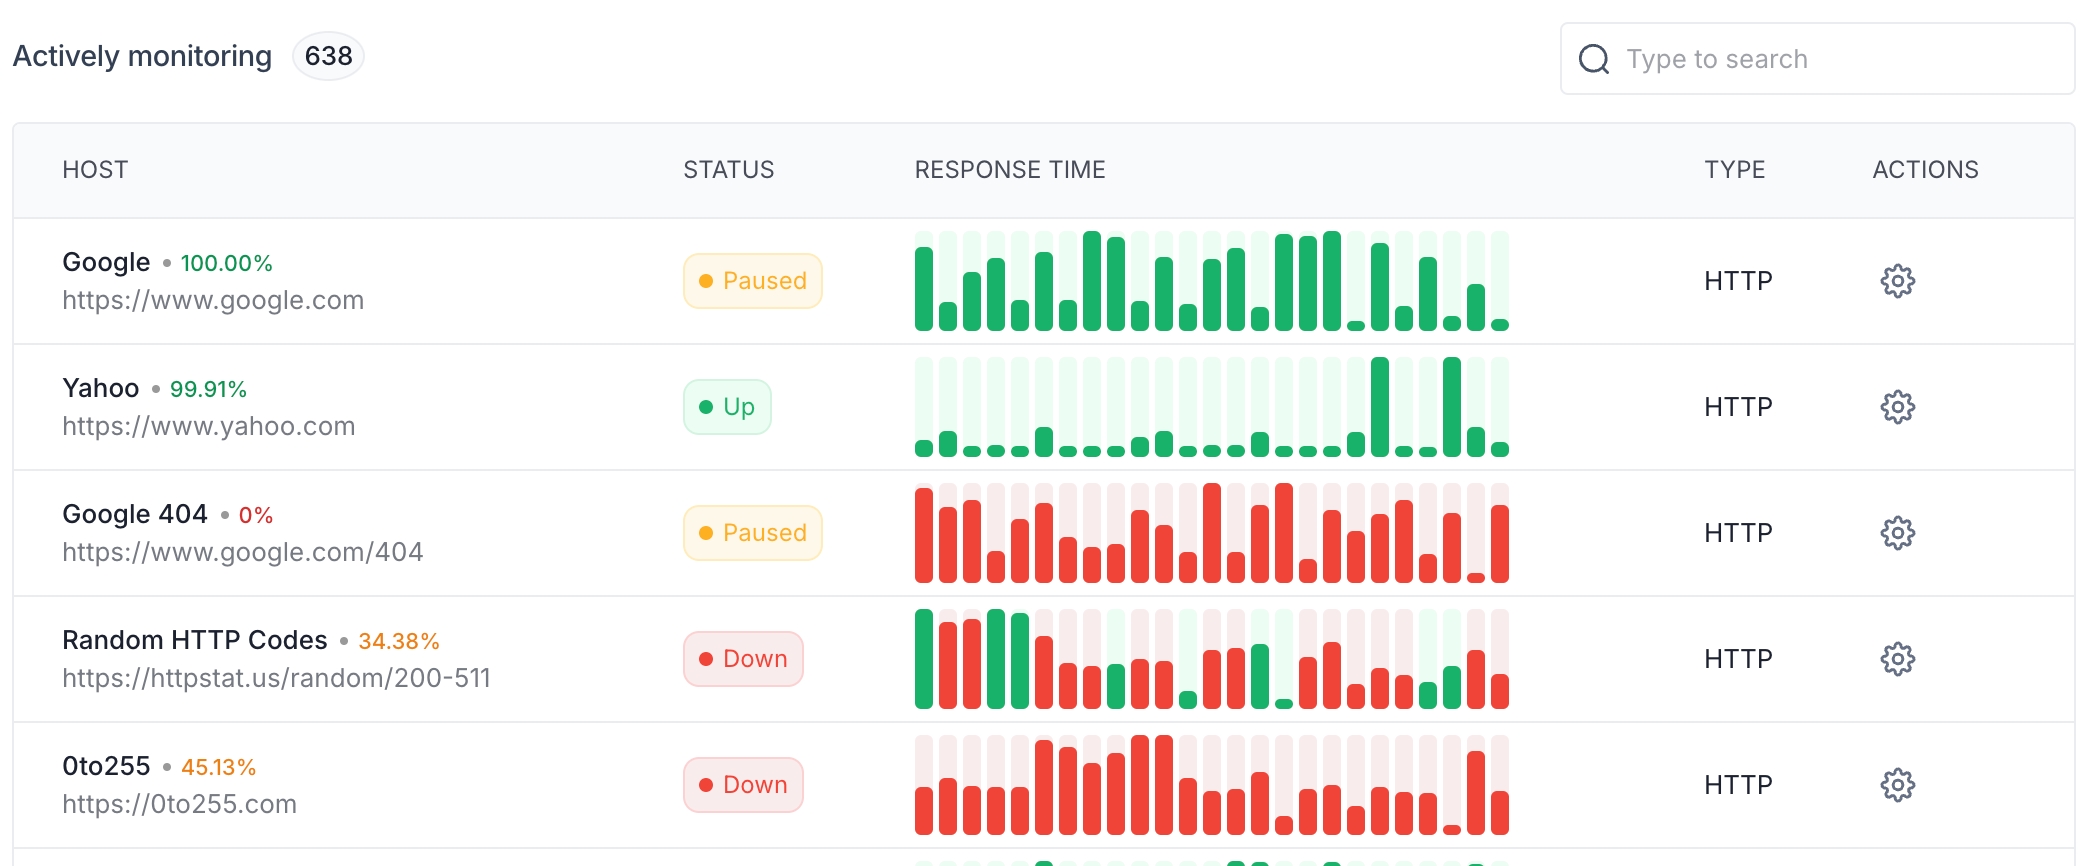
Monitoring table
This section lists all the services being monitored, showing key details for each service:
Host: The name and URL of the service being monitored.
Status: The current status of the service, indicated by color-coded icons:
Green: Up (operational)
Red: Down (non-operational)
At the top-right corner of the dashboard, there’s a button labeled Create monitor. This allows users to add a new server or website to monitor.
A search bar is available above the list of monitored services, enabling users to quickly locate specific services by name or URL.
Status indicators
Green: Indicates the service is currently up and operational.
Red: Indicates the service is down or experiencing problems.
Yellow: Indicates that monitoring for this service is paused.
Each service has a graph in the Response Time column that displays its performance history over time. This allows you to easily visualize any spikes or drops in performance.
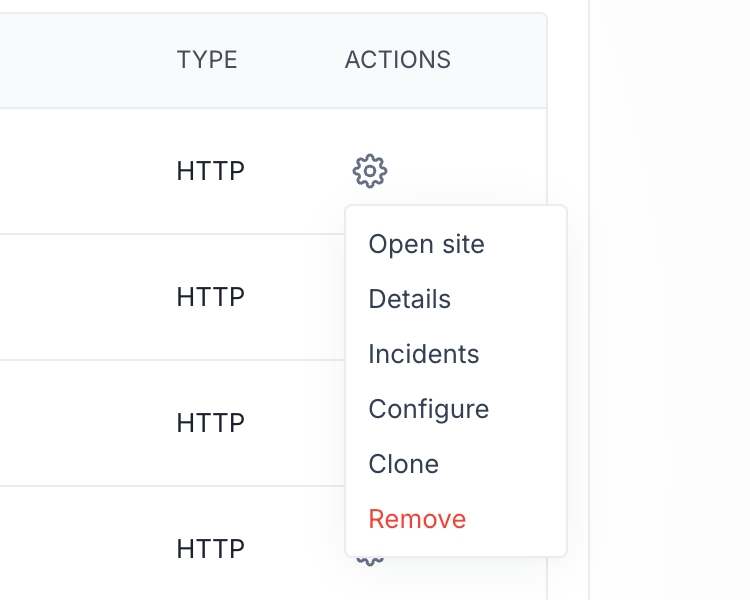
The gear icon next to each monitored service allows for quick access to configuration settings or additional monitoring options.
When you click on the gear icon, you'll see a few options that correspond to that host:
Open site: Opens the monitored website or server in a new browser tab.
Details: Displays historical uptime and performance metrics for the service.
Incidents: Shows a log of all incidents related to the service, including downtime and performance issues.
Configure: Allows modification of monitoring parameters like check frequency and alert preferences.
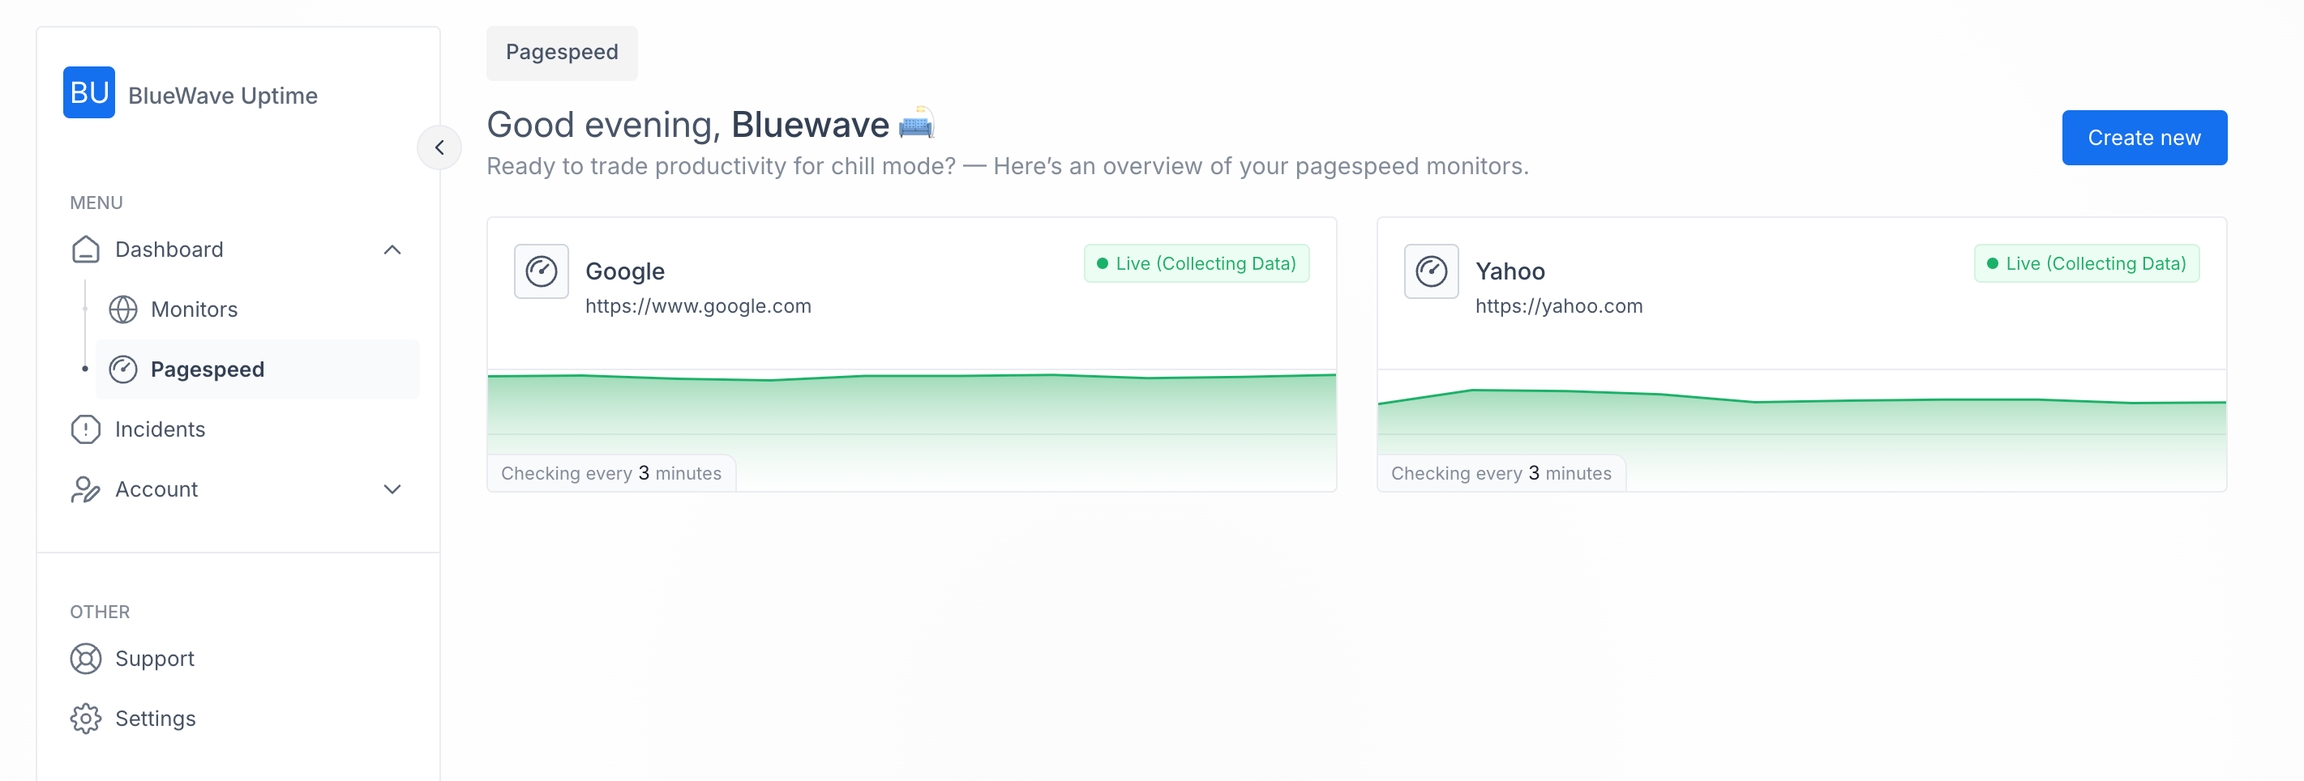
Under Dashboard > Pagespeed, you can see an overview of pagespeed monitors for different websites. This dashboard helps you view optimal website performance by providing clear, actionable insights into various aspects of your site's speed and user experience.
The Pagespeed section requires a Google PageSpeed API. Click here and get your API, and then add it in Settings.
When you add a new page speed monitor, it is added here. Click on the "Create new" button to add a new page speed.
Here, both monitors are shown as "Live (Collecting Data)" with a green dot, indicating they are actively monitoring. Each monitor has a small graph, representing recent pagespeed performance over time.
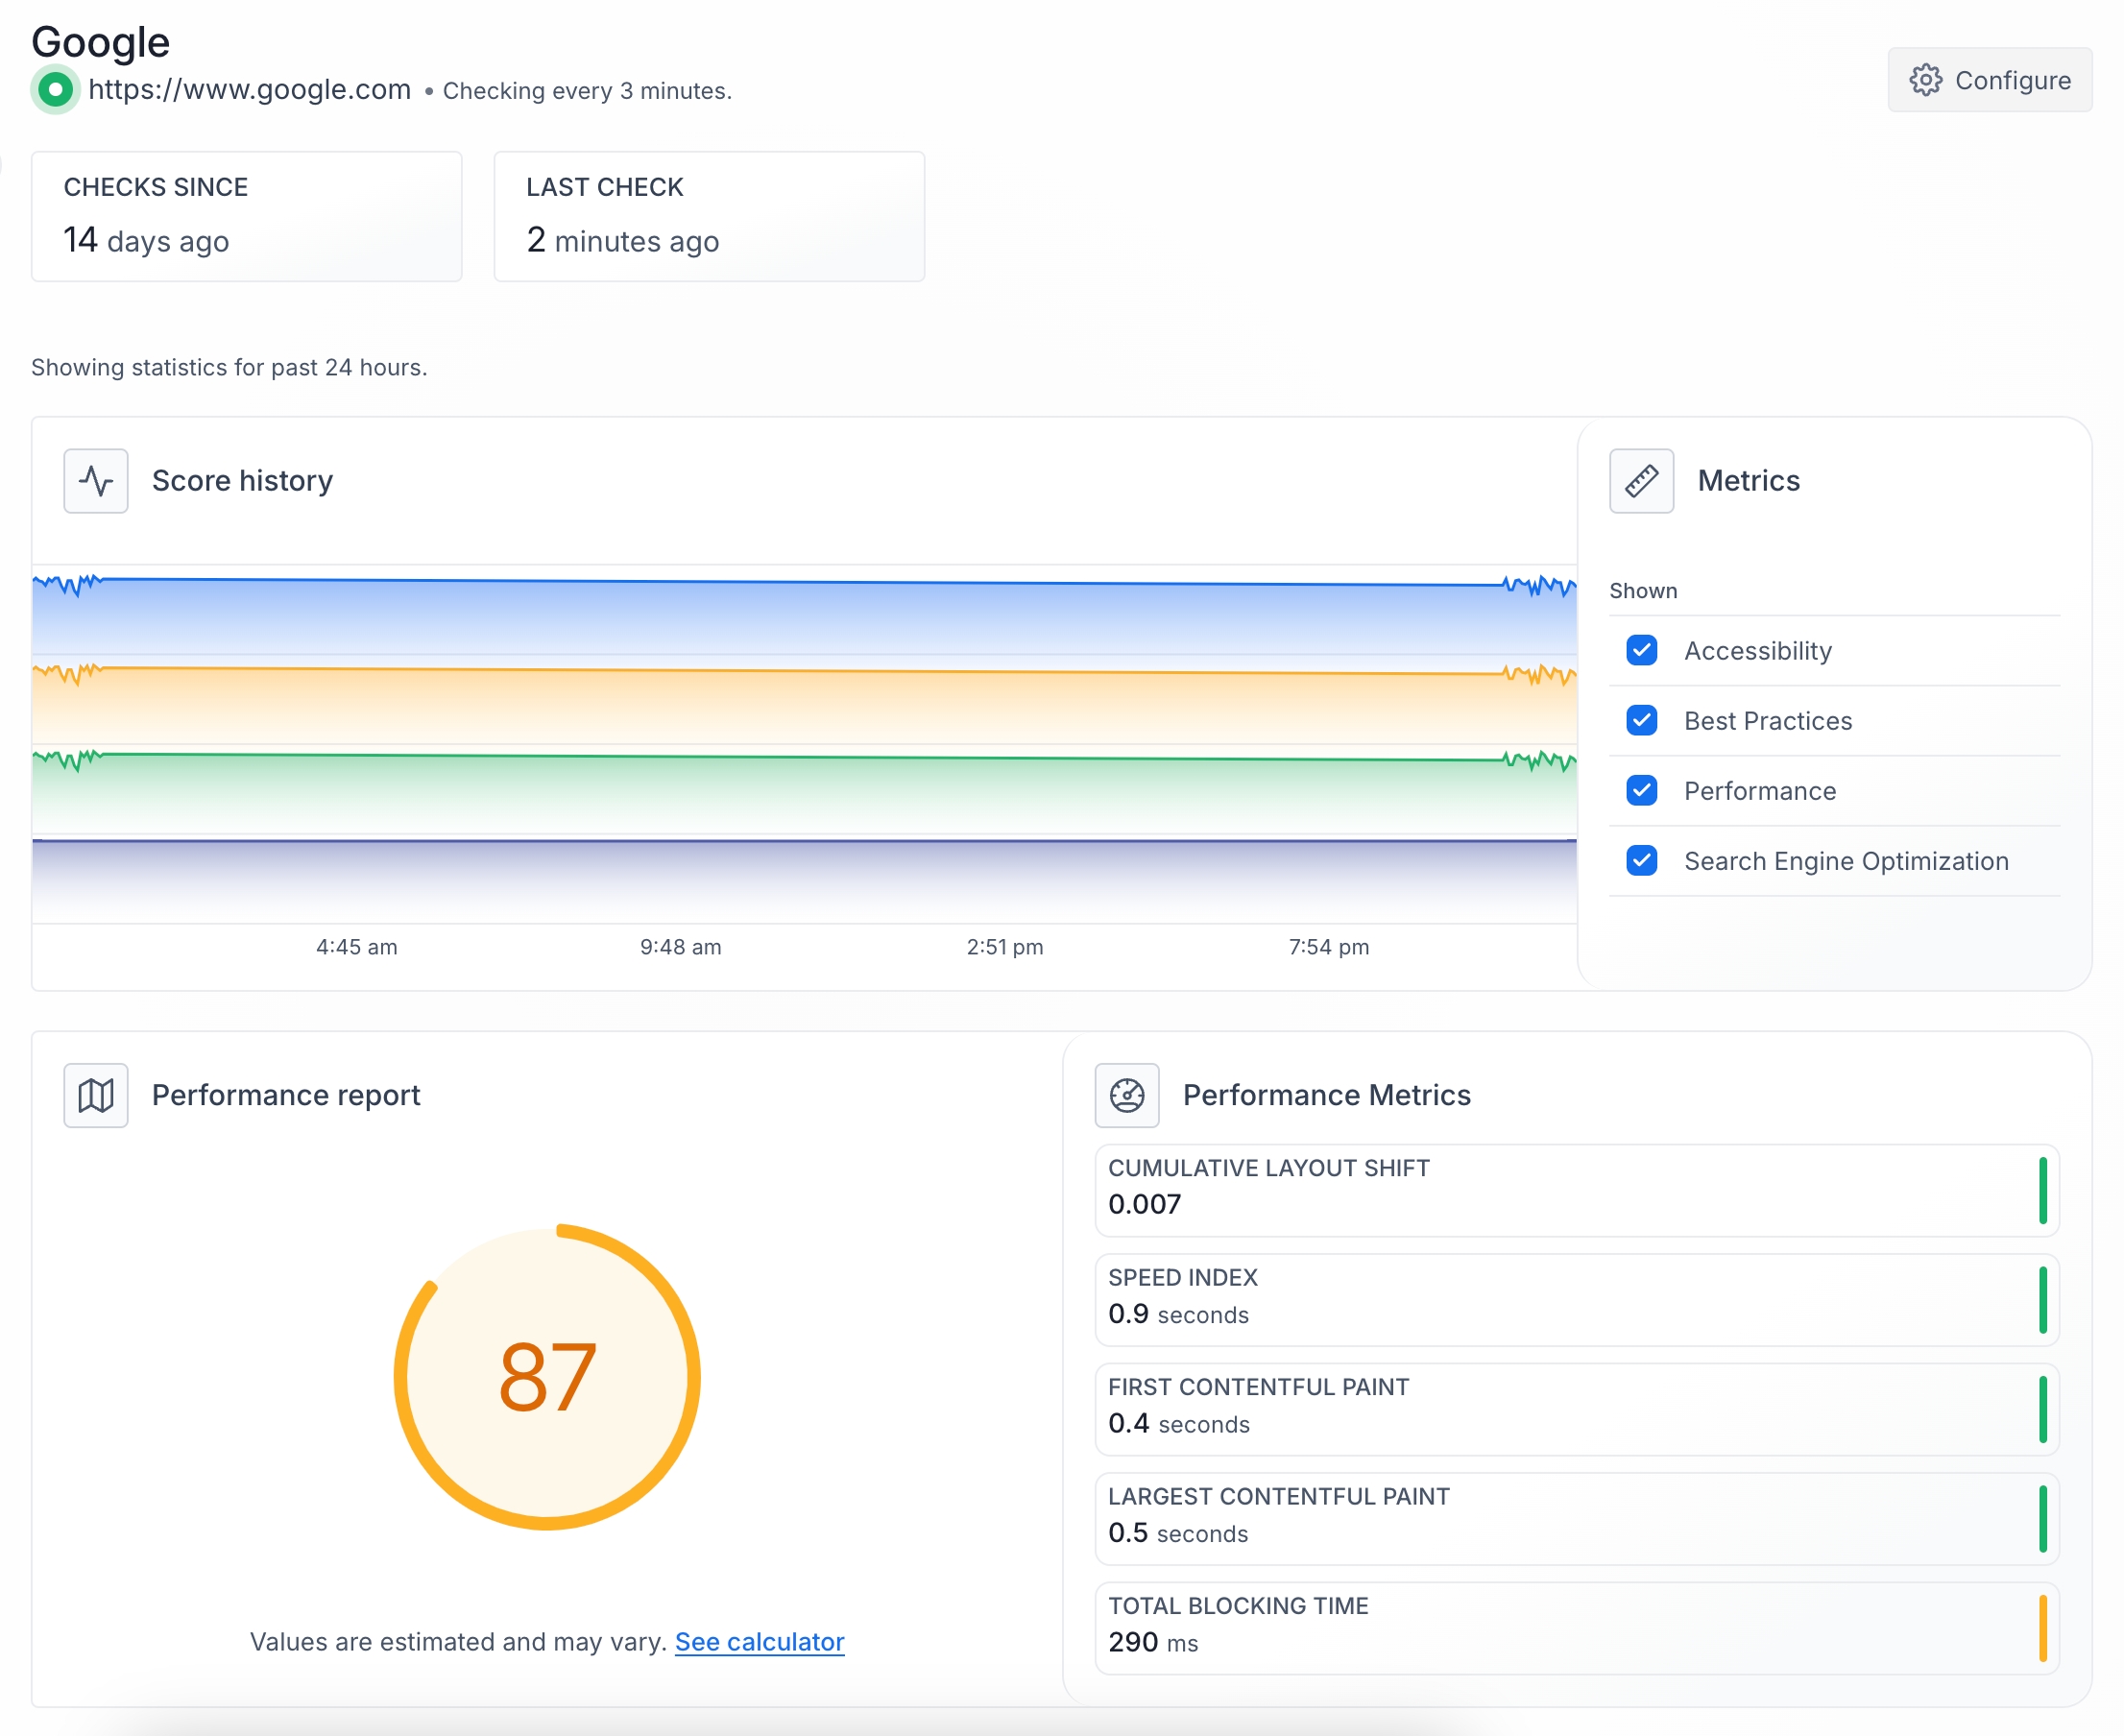
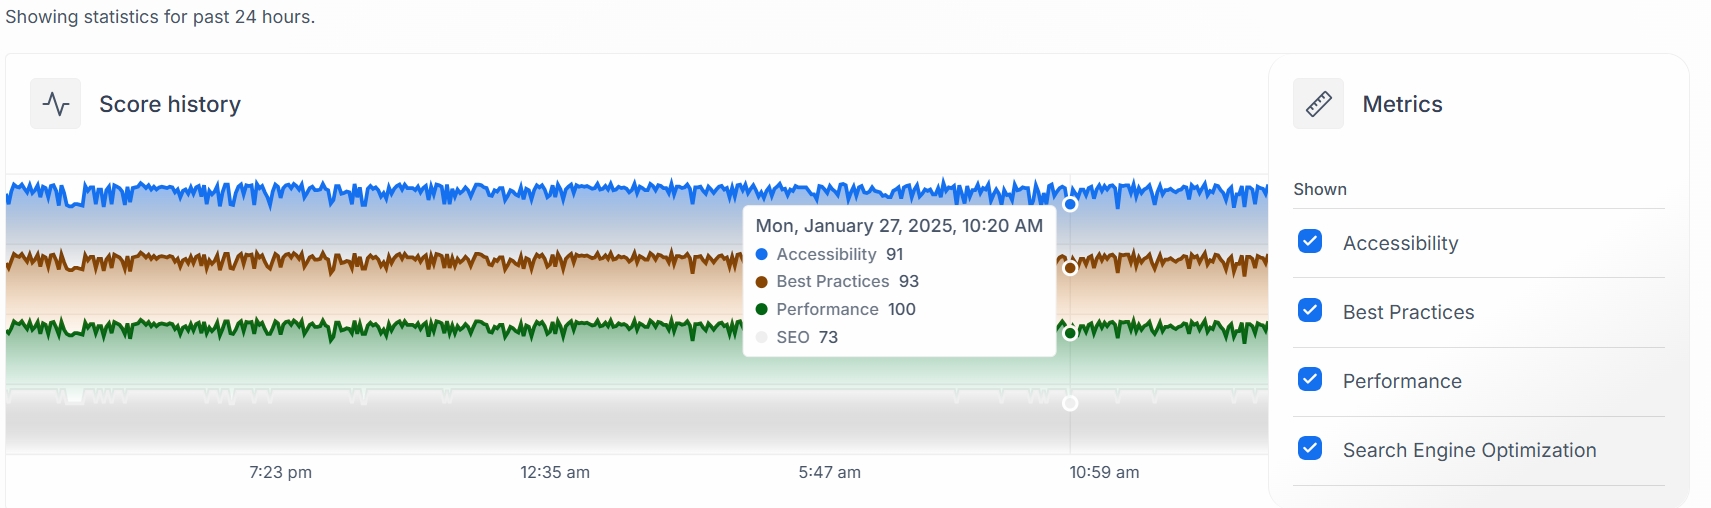
When you click on a pagespeed card, you'll see an overview of data collected using Google's PageSpeed Monitor API.
Shows performance trends over the past 24 hours. Four colored lines represent different metrics:
Accessibility (blue)
Best Practices (orange)
Performance (green)
Search Engine Optimization (purple)
You can toggle these metrics on/off using the checkboxes on the right
You'll see an overall score of your server's pagespeed.
Cumulative Layout Shift: Measures visual stability
Speed Index: How quickly content is visually displayed
First Contentful Paint: Time until the first content is rendered
Largest Contentful Paint: Time until the largest content element is rendered
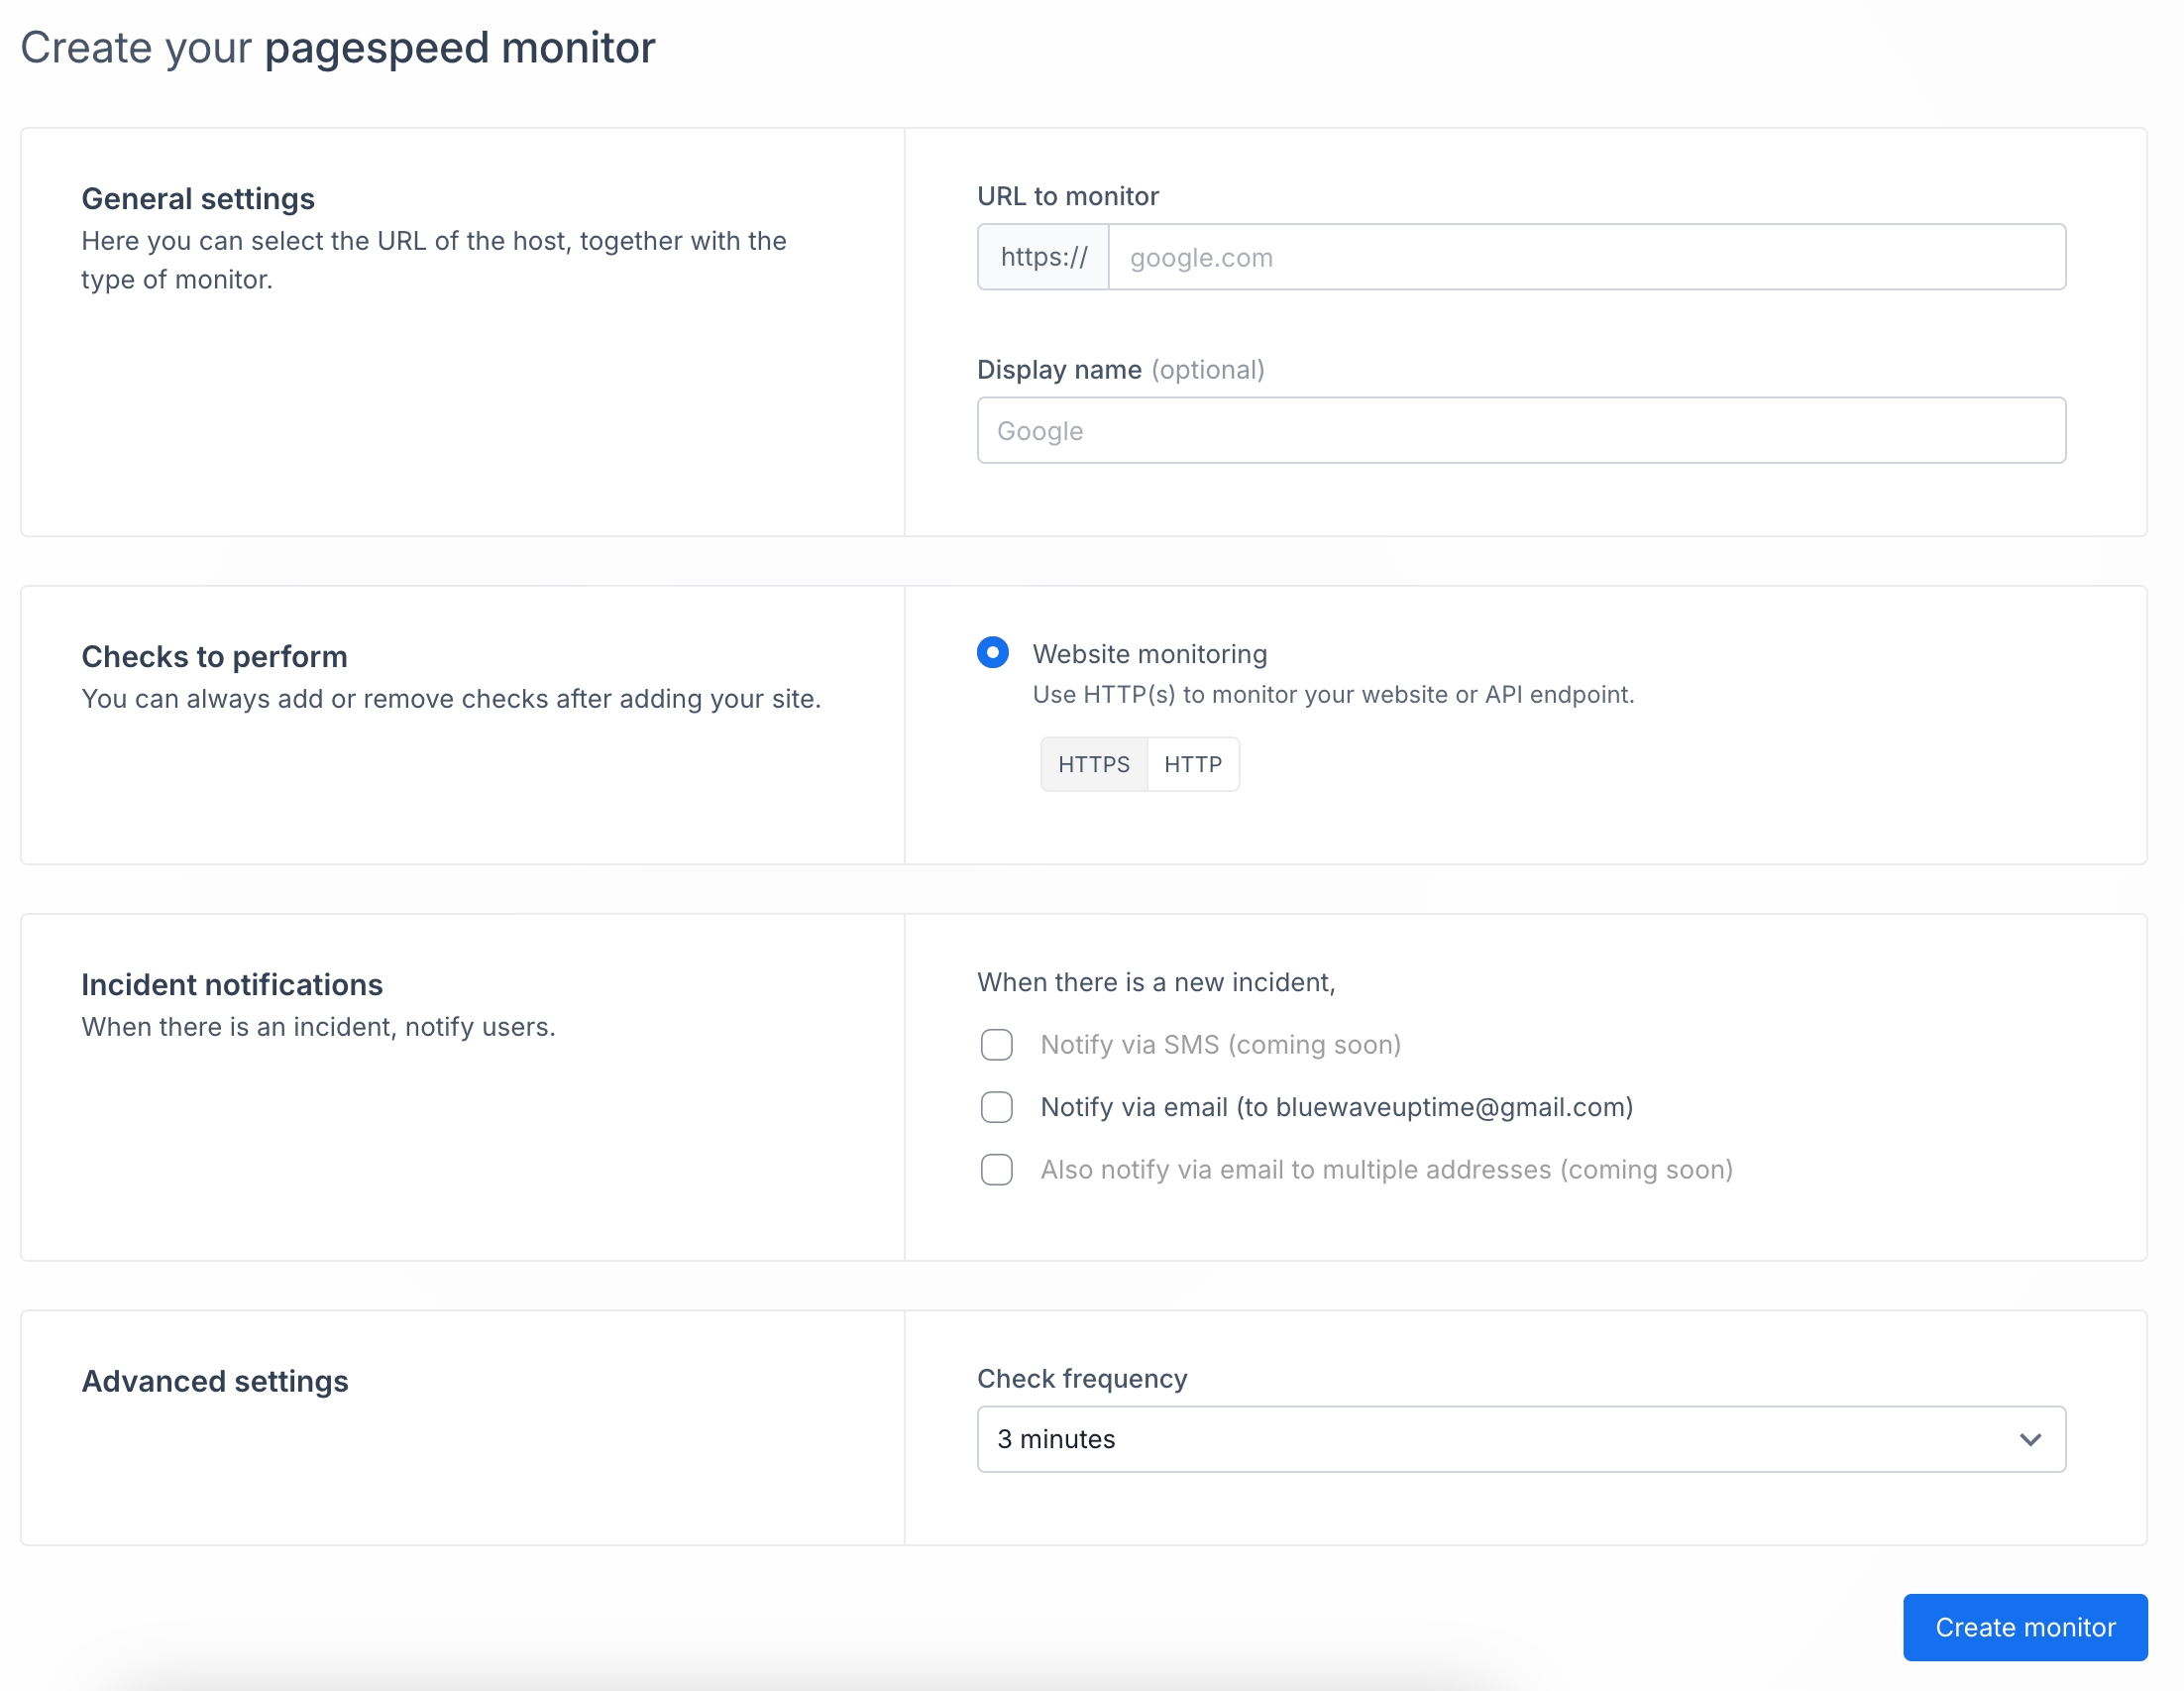
When you are on a pagespeed screen, click on the "Create pagespeed" button. You'll see a screen similar to this:
This page allows you to set up a new pagespeed monitor for your website. Follow these steps to configure your monitor:
URL to monitor: Enter the full URL of the website you want to monitor (e.g., ).
Display name (optional): Enter a custom name for your monitor to easily identify it in your dashboard.
Here, you can choose between HTTPS (recommended for secure sites) or HTTP protocols.
Notify via email (to your email address)
Check frequency: Choose how often you want the system to check your website's pagespeed. The default is set to 3 minutes.
After configuring all settings, click the "Create monitor" button at the bottom right of the page.
Ensure the URL you enter is correct and accessible.
Choose a descriptive display name if you're monitoring multiple sites.
Consider the trade-off between check frequency and resource usage. More frequent checks provide more data but may use more resources.
Remember to enable your preferred notification methods to stay informed about incidents.
After creating the monitor, you'll be able to view its performance data in your dashboard. This will help you track your website's pagespeed and optimize its performance over time.
If you are having trouble running Checkmate, those are the general steps you can take towards finding the issue.
Verify port availability:
Ensure the port used by the Checkmate server (e.g., 5000) is not already in use by another application or container.
Check environment variables: Verify that all required environment variables are set correctly with valid values.
Check database connections: If using external databases (Redis, MongoDB), verify that the client points to the correct IP address and port for each database.
Check for port interference: Verify that no other containers or applications create port conflicts.
Check network connectivity:
Verify your internet connection.
Check for firewall/antivirus interference.
Review proxy server settings.
Check Docker server status:
Access the Docker dashboard to check the server container's status.
Inspect the server container's logs for error messages.
Check application configuration:
Review client-side configuration for any misconfigurations.
Enable debug logging: Enable error or warn log levels in the client application for more detailed troubleshooting information.
Test server endpoint directly:
Try accessing the server endpoint directly in your browser (e.g., localhost:5000/api/v1).
If you see any message other than "Cannot GET /api/v1" error, it indicates that the server might not be binding to the specified port or is not running correctly, regardless of what the server logs show.
Restart Checkmate Docker services:
Restart the Checkmate server container.
Restart the Checkmate client container.
Restart the MongoDB client container.
Clear browser cache and cookies
Clear your browser's cache and cookies.
A: Normally the application will automatically redirect you to the register page if you have not yet created an account.
If the client cannot reach the server then the server client does not know that you do not have an account yet and won't redirect you.
If you are not redirected to /register and cannot see the sign-up page automatically, this means that the client cannot reach the server. Make sure the Checkmate Docker server is running.
If you get an error similar to "Uncaught (in promise) Error: A listener indicated an asynchronous response by returning true, but the message channel closed before a response was received at v (VM7845 vendor.js:142:18472)", remove your "AdBlocker Ultimate". This adblocker is known to not work with Checkmate.
You can use a to expose the socket to Checkmate.
Problem: I'm running Checkmate on a machine (like with IP 192.168.1.2). I can access it via and it works well. But if I want to access it outside this machine, it doesn't work. I open , and it loads some part of the UI, but fails after.
Solution: You need to specify the IP address of your host machine (192.168.1.2 in our case) in docker-compose.yml, do the client part know, where the server is. You can do it by updating the address in this variable:
Yes, this is configurable via the env file. TOKEN_TTL is the parameter you would want to set.
Create a topic on your NTFY server.
(Only if you require authentication for your NTFY Server):
Generate an authentication token via the command below on the NTFY server:
echo -n "Basic echo -n 'username:password' | base64" | base64 | tr -d '=' (Change username:password in your actual NTFY username and password)
Add the link to the webhook in CheckMate.
If the Checkmate server fails to interact with docker.sock when mounting the volume, follow those troubleshooting steps:
Check the Docker group: Determine the Group ID (GID) of the Docker group.
Method 1 (Direct docker.sock mount): Ensure the user field in your Checkmate server configuration includes the GID of the Docker group.
Compose YAML:
user: nobody:281
or
Compose YAML:
user: nobody:<Docker Group Name>
Important: The User ID (UID) is typically not critical for this scenario.
For docker CLI you would add new container variables:
PUID: UID
PGID: Docker GID
Another method is that, if using a Docker socket proxy, ensure the DOCKER_HOST environment variable is correctly set:
Compose YAML
environment:
- DOCKER_HOST=tcp://docker-socket-proxy:2375
Check Docker socket permissions
Verify read-only access: If mounting `docker.sock` directly, ensure the read_only: true option is set in your Checkmate server configuration. This prevents accidental modifications to the Docker daemon.
Restart Checkmate server: After making any configuration changes, restart the Checkmate server to apply the updates.
Once the server is restarted, set up a new docker container monitoring with your container ID within your Checkmate server. Monitor the server logs for any error messages related to Docker communication.
To collect hardware information from your servers, you need Capture, a server monitoring agent for Checkmate. Capture receives requests from Checkmate (server), and sends the necessary infrastructure status data, eg CPU, RAM, disk or network packet information.
When Capture runs on the remote server, it starts collecting hardware information from the host machine and exposes it through a RESTful API. The agent is designed to be lightweight and easy to use.
Capture is available for Linux, Windows, Mac, Raspberry PI or any device that can run Go.
With Authentication: https://ntfy.example.com/topic?auth=authenticationtoken-from-step2
Without Authentication: https://ntfy.example.com/topic
UPTIME_APP_API_BASE_URL: "http://192.168.1.2:5000/api/v1"getent group docker # This will usually return something like docker:281)Status pages: Shows a list of public status pages, and a way to add them.
Maintenance: Sets up maintenance windows for your servers.
Settings: Provides customization options for the application’s behavior, monitoring frequency, and notification preferences.
Yellow: Paused (monitoring paused for this service)
Response time: A visual graph showing the performance trends of the service over time. Each bar represents the response time of the service at a given interval. Green bars indicate a healthy response time, while red bars indicate slower or problematic performance.
Type: Indicates the type of service being monitored (either Ping or HTTP).
Actions: This column has settings icons that allow the user to configure the monitoring details of the specific service.
Clone: Duplicates the current service’s monitoring settings for a new service.
Remove: Removes the service from the monitored list and stops all monitoring activities.
Total Blocking Time: Sum of all periods between FCP and Time to Interactive
In this installation, the React front-end is served from the API server. There is no Client image as it is not required. Note that this is still a React SPA and is served to your browser where it runs.
Requests to the API server are made from your browser. If that is on a different machine than your API server, then you must configure the API URL appropriately (see below).
To get started on your local machine:
Download the Docker compose file.
Run docker compose up to start the application.
Your application will spin up at http://localhost:52345
If you are deploying Checkmate on a remote machine, check the note below, as you need to modify 3 variables:
If you’d like to host your Checkmate instance somewhere other than the machine your browser is running on, you will need to update these variables. As an example, if you were hosting at 143.110.231.94, use the following:
Where,
UPTIME_APP_API_BASE_URL points the frontend to the backend
UPTIME_APP_CLIENT_HOST is used for building some links that point to the frontend
CLIENT_HOST is the origin that the API server will approve requests from
If you are upgrading from a previous deployment:
As long as you mount the same directories to the MongoDB image you'll retain your data.
The Mongo part of the application remains unchanged.
You can always back up your data directory as well before migration.
In this installation, the React front-end is served by an Nginx Docker image (named Frontend) and is independent of the API server.
Note that if you want to configure Nginx, you will have to mount a volume to the Frontend image to override the default config:
Download our Docker compose file
Run docker compose up to start the application
Now the application is running at http://localhost
Optional config:
If you want to monitor Docker containers, uncomment this line in docker-compose.yaml:
This gives the app access to your docker daemon via unix socket, please be aware of what you are doing.
Download our Docker compose file
Edit the UPTIME_APP_API_BASE_URL variable in the docker-compose file to point to your remote server.
Run docker compose up to start the application
Now the application is running at http://<remote_server_ip>
Optional config:
If you want to monitor Docker containers, uncomment this line in docker-compose.yaml:
This gives the app access to your Docker daemon via unix socket, please be aware of what you are doing.
This is like option 2, but for Windows machines.
Fork the repository: Go to the Checkmate GitHub repository and fork it to your account.
Clone the repository: Open your terminal or command prompt and run:
Navigate to the server directory:
cd server
Install dependencies:
npm install
Create a .env File: Add a .env file in the server directory to hold your server secrets.
Navigate to the main directory:
cd ..
Build the Docker Image:
Navigate to the docker/dev directory:
cd docker/dev
Run Docker container:
Navigate to the server directory:
cd into server.
Run the development server:
npm run dev
Your backend should now be up and running.
Navigate to the client directory:
cd client
Install dependencies:
npm install
Create a .env File: Add a .env file in the client directory to hold your client secrets.
Run the client (a.k.a frontend):
npm run dev
Your frontend should now be up and running.
If you would like to install Checkmate on Raspberry PI 4, Raspberry PI 5 or MacOS, use this link to download the Docker compose file. Then run the usual docker compose up command to start instances.
Your application will spin up at http://localhost:52345
Configuration environment variables are the same as what you'd use in Option 1 section above.
When you’re working on the app locally, it’s painful to rebuild and reload Docker images every time you tweak the client or server. Instead, run those services directly on your host machine—this gives you instant feedback and lets you use hot-reload without waiting for image builds.
At the same time, we still include MongoDB as a Docker container. This service rarely changes, so keeping it in container simplifies setup and avoids cluttering your host environment.
Make sure you change the directory to the specified directories, as paths in commands are relative.
This application consists of a frontend (client) and a backend (server) in a single repository. Start by cloning the repo, as it contains everything you need, except the Capture agent if you plan to use the Infrastructure Monitoring feature.
This application requires a MongoDB instance. If you want, you can use our Docker images. Otherwise, you can provide your instances as well.
From your checkmate directory you created above, cd into server/dev.
Run build_images.sh
Run docker run -d -p 27017:27017 -v $(pwd)/mongo/data:/data/db --name uptime_database_mongo uptime_database_mongo
The server requires some configuration to run.
From your checkmate directory, CD into the server directory.
Run npm install.
In the server directory, create a .env file to hold your configuration. This is where you'll add your environment variables.
Add the .
Start the server by running npm run dev.
The client also requires some configuration in order to run.
From your checkmate directory, CD into the client directory.
Run npm install.
In the client directory, create a .env file to hold your configuration. This is where you'll add your environment variables.
Add the .
Start the client by running npm run dev
The client is running at localhost:5173 (unless you changed the default port).
The server is running at localhost:52345 (unless you changed the default port).
Change directory to the Client directory
Install all dependencies by running npm install
Add a .env file to the Client directory with the following options:
VITE_APP_API_BASE_URL
Required
string
Base URL of server
{host}/api/v1
VITE_APP_LOG_LEVEL
Optional
string
Log level
"none"|"error" | "warn" |
Sample ENV file:
Change the directory to the Server directory
Install all dependencies by running npm install
Add a .env file to the Server directory with the following options:
Configure the server with the following environmental variables. Note that those variables need to be set in .env files if you are running the local development server, or in the Docker compose file if you use docker compose.
CLIENT_HOST
Required
string
Frontend host
JWT_SECRET
Required
string
JWT secret
Sample, minimum env file is as follows:
Note that for the Pagespeed feature to work, you need a free Google Pagespeed API key from this link.
Our API documentation follows the OpenAPI spec. You can see the documentation on your local development server at http://localhost:{port}/api-docs . You can also view the documentation on our demo server here. Just a note that the API documentation is still in the works. Let us know in our Discord channel if you have any questions about the latest status.
Errors are returned in a standard format:
{"success": false, "msg": "No token provided"}
Errors are handled by error handling middleware and should be thrown with the following parameters
status
integer
500
Standard HTTP codes
message
string
"Something went wrong"
An error message
service
string
"Unknown Service"
Example:
Errors should not be handled at the controller level and should be left to the middleware to handle.
CPU Monitoring
Temperature
Load
Frequency
Usage
Memory Monitoring
Disk Monitoring
Usage
Inode Usage
Read/Write Bytes
S.M.A.R.T. Monitoring (Self-Monitoring, Analysis and Reporting Technology)
Network Monitoring
Docker Container Monitoring
GPU Monitoring (coming soon)
Warning: S.M.A.R.T. monitoring is only available when using binary installation (not Docker). It also requires the
smartmontoolspackage to be installed on your system, as Capture relies on thesmartctlutility for collecting S.M.A.R.T. data. Installsmartmontoolsusing your system's package manager (e.g.,apt install smartmontoolsfor Debian/Ubuntu,yum install smartmontoolsfor CentOS/RHEL). Note: S.M.A.R.T. monitoring is not supported in Docker installations.
Docker installation is recommended for running the Capture. Please see the Docker run flags section for more information.
Pull the image from the registry and then run it with one command.
If you don't want to pull the image, you can build and run it locally.
Before running the container, please make sure to replace the REPLACE_WITH_YOUR_SECRET with your own secret.
! You need to put this secret to Checkmate's infrastructure monitoring dashboard
-v /etc/os-release:/etc/os-release:ro to get platform information correctly
-p 59232:59232 to expose the port 59232
-d to run the container in detached mode
-e API_SECRET=REPLACE_WITH_YOUR_SECRET to set the API secret
(optional) -e GIN_MODE=release/debug to switch between release and debug mode
You can download the pre-built binaries from the GitHub Releases page.
Recommended installation path is /usr/local/bin.
Do not forget to make the binary executable.
You can install the Capture using the go install command.
You can build the Capture from the source code.
Clone the repository
Change the directory
Build the Capture
or
Run the Capture
Configure the capture with the following environment variables:
API_SECRET
The secret key for the API
Required
string
-
Any string value
PORT
The port that the Capture listens on
Optional
Please make sure to replace the default your_secret with your own secret.
! You need to put this secret to Checkmate's infrastructure monitoring dashboard
UPTIME_APP_API_BASE_URL=http://143.110.231.94:52345/api/v1
UPTIME_APP_CLIENT_HOST=http://143.110.231.94
CLIENT_HOST=http://143.110.231.94git clone https://github.com/your-username/checkmate.git
cd checkmatedocker build -f ./docker/dev/mongoDB.Dockerfile -t uptime_database_mongo . # volumes:
# - /var/run/docker.sock:/var/run/docker.sock:ro # volumes:
# - /var/run/docker.sock:/var/run/docker.sock:roVITE_APP_API_BASE_URL="http://localhost:52345/api/v1"
VITE_APP_LOG_LEVEL="debug"CLIENT_HOST="http://localhost:5173"
JWT_SECRET="my_secret"
DB_CONNECTION_STRING="mongodb://localhost:27017/uptime_db"
TOKEN_TTL="99d"
ORIGIN="localhost"const myRoute = async(req, res, next) => {
try{
const result = myRiskyOperationHere();
}
catch(error){
error.status = 404
error.message = "Resource not found"
error.service = service name
next(error)
return;
}
}git clone [email protected]:bluewave-labs/capturecd capturejust buildgo build -o dist/capture ./cmd/capture/./dist/capturedocker run -v /etc/os-release:/etc/os-release:ro \
-p 59232:59232 \
-e API_SECRET=REPLACE_WITH_YOUR_SECRET \
-d \
ghcr.io/bluewave-labs/capture:latestdocker buildx build -f Dockerfile -t capture .docker run -v /etc/os-release:/etc/os-release:ro \
-p 59232:59232 \
-e API_SECRET=REPLACE_WITH_YOUR_SECRET \
-d \
capture:latestdocker run -v /etc/os-release:/etc/os-release:ro \
-p 59232:59232 \
-e API_SECRET=REPLACE_WITH_YOUR_SECRET \
-d \
ghcr.io/bluewave-labs/capture:latestchmod +x /usr/local/bin/capturego install github.com/bluewave-labs/capture/cmd/capture@latestPORT = your_port
API_SECRET = your_secret
GIN_MODE = release/debug# API_SECRET is required
API_SECRET=your_secret GIN_MODE=release ./capture
# Minimal required configuration
API_SECRET=your_secret ./dist/captureinteger
59232
0 - 65535
GIN_MODE
The mode of the Gin framework
Optional
string
system -> debug docker -> release
release, debug
VITE_APP_DEMO
Optional
boolean
Demo server or not
true|false |
DB_CONNECTION_STRING
Required
string
Specifies URL for MongoDB database
ORIGIN
Required
string
Origin where requests to server originate from, for CORS purposes
localhost
LOG_LEVEL
Optional
string
Debug level
Can be one of debug, info, warn, error
TOKEN_TTL
Optional
string
Time for token to live
In vercel/ms format https://github.com/vercel/ms
Name of service that threw the error
Follow these steps to create a new monitor.
Select the type of checks you want to configure:
Website monitoring
Uses HTTP(s) protocols to monitor your website or API endpoint.
Options: HTTPS or HTTP.
Ping monitoring
Confirms the server's availability using ping responses.
Docker monitoring: Monitors whether a Docker container is running.
Ensure your Docker daemon is exposed.
Docker IDs must be the full 64 char Docker ID. You can run docker inpsect <short_id> to get the full container ID.
Port monitoring
Checks whether your port is open or not.
Game server monitoring
Checks whether your game server is up or not (supports hundreds of game server types)
This section changes depending on the type of the monitor you want use, but in general you'd need to enter URL, display name, or port.
This is where you add a notification to a monitor. In order to attach a notification to a monitor, first you need to go to the Monitor section on the left (Sidebar), add a notification there, and its name will popup here.
If there is a TLS/SSL error when connecting to a service, you can tell Checkmate to continue checking the service's uptime.
Set the frequency of checks. The default is 1 minute, but you can adjust this based on your requirements.
When creating or configuring an uptime monitor in Checkmate, you have access to advanced settings that allow for precise response validation. This guide explains how to use these features effectively.
Match method
The Match method determines how Checkmate compares your expected value with the actual response data.
The Expected Value field defines what you want to check for in the response body content.
The JSON Path field allows you to extract and validate specific data from JSON responses using JMESPath syntax.
When testing APIs that return JSON responses
When you need to validate nested data within a complex response
When you only care about a specific value in a larger JSON object
Scenario 1: Checking Website Availability
Scenario 2: Verifying User Data in API Response
Scenario 3: Checking for Error Messages
When monitoring websites, it’s essential to understand how Checkmate evaluates responses. This is how response checking works:
Response Body Only: The Expected Value field checks the response body content only, not HTTP metadata like status codes. Checkmate does not provide a direct way to check the HTTP status code through Expected Value.
For Website Monitoring
Focus on checking for content that should be present on your website:
docker run -d -p 27017:27017 -v "$(pwd)/mongo/data:/data/db" --name uptime_database_mongo uptime_mongo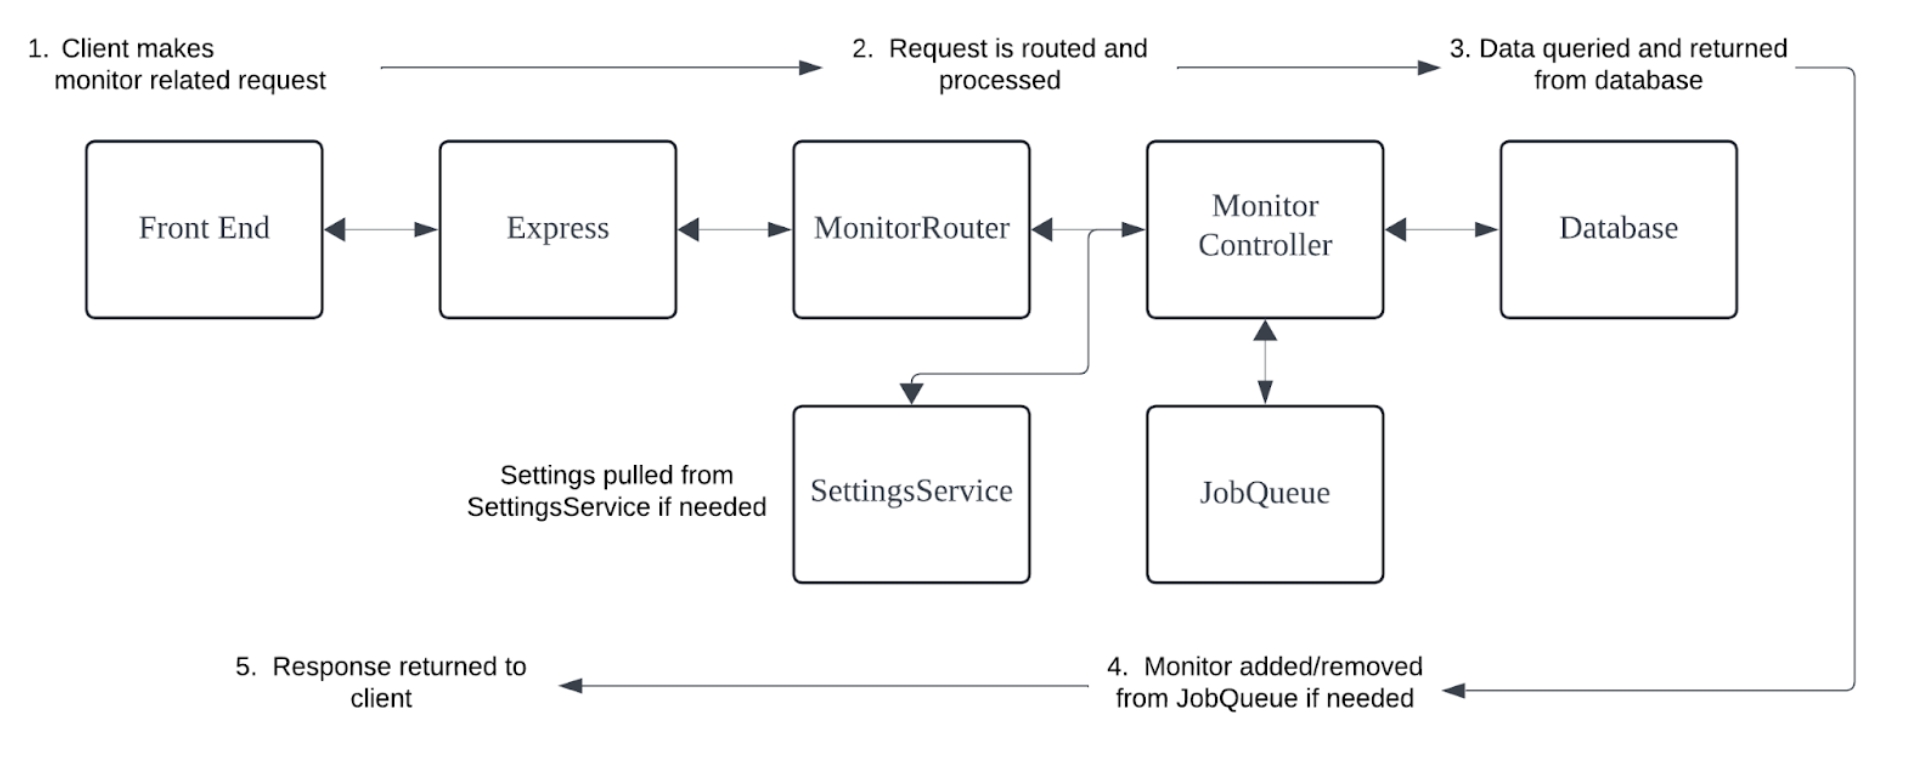
Use Expected Value: <html with Match Method: Include for most websites
For JSON API Monitoring
If the API includes the status code in the response body, use JSON Path to extract it:
JSON Path: status with Expected Value: success
For API health checks, look for specific content or status indicators in the response body
Include
empty
Checks if the HTML document is properly closed
API
"success"
Include
empty
Checks if response contains success message
JSON API
true
Equal
status.success
Checks if success field is true in JSON
Method
Description
Example
Equal
Checks if the response exactly matches the expected value
success matches only if response contains exactly “success”
Include
Checks if the response contains the expected value
Welcome matches if response contains “Welcome” anywhere
Regex
Uses regular expression pattern matching
^[A-Z][a-z]+$ matches any capitalized word
Field
Value
Explanation
Match Method
Include
Partial match is sufficient
Expected Value
</html>
Looking for HTML closing tag
JSON Path
empty
Check the entire response
Field
Value
Explanation
Match Method
Equal
Exact match required
Expected Value
true
Checking if user is active
JSON Path
data.user.active
Extract the active status from the user object
Field
Value
Explanation
Match Method
Include
Partial match is sufficient
Expected Value
error
Looking for any error message
JSON Path
message
Extract only the message field
Website
Expected Value
Match Method
JSON Path
Explanation
Google.com
Include
empty
Checks if “Google” appears in the response
GitHub.com
GitHub
Include
empty
Checks if “GitHub” appears in the response
Any site
</html>