Using Checkmate
This user guide helps new users navigate and understand the Checkmate dashboard layout and functionality.
General Overview
Checkmate is an open-source server monitoring tool designed to track the uptime, downtime, and performance of servers, websites, or web applications.
It provides real-time alerts, status updates, and detailed response time metrics.
Sidebar menu
The sidebar on the left contains the following sections:
Uptime: Shows the uptime of your monitors
Pagespeed: Shows your web page speed and performance
Infrastructure: Gets RAM, CPU, disk etc data from your servers and shows on a UI.
Incidents: A section where alerts and incidents regarding the monitored services are logged. This helps users investigate issues and track downtime history.
Status pages: Shows a list of public status pages, and a way to add them.
Maintenance: Sets up maintenance windows for your servers.
Settings: Provides customization options for the application’s behavior, monitoring frequency, and notification preferences.
User info section
At the bottom of the sidebar, you’ll see the current logged-in user alongside with the role. When you click on the hamburger menu, you'll see sections like Profile, Password, Team and Log out.
Dashboard content
The main section of the dashboard displays an overview of the monitored services, including their current status and key performance indicators.
The dashboard offers a summary of your uptime monitors:
Up: The number of monitored services that are currently operational.
Down: The number of monitored services that are currently experiencing issues.
Paused: The number of services that have their monitoring paused.
Monitoring table
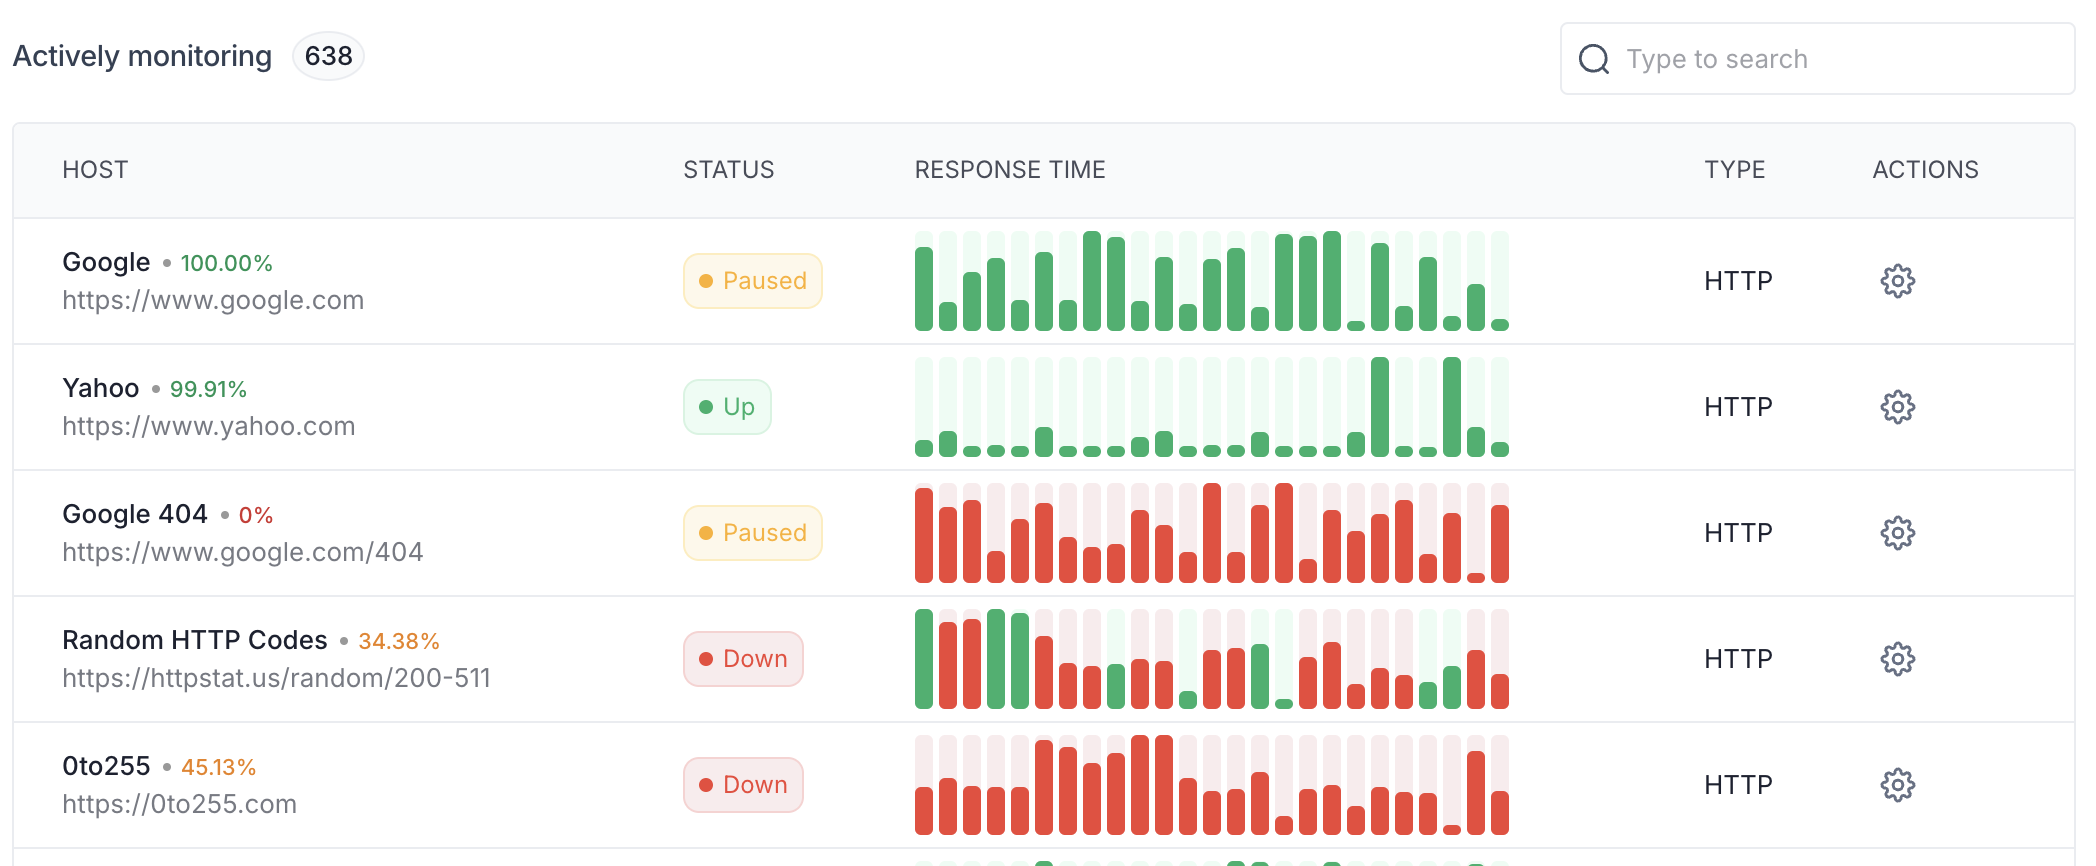
This section lists all the services being monitored, showing key details for each service:

Host: The name and URL of the service being monitored.
Status: The current status of the service, indicated by color-coded icons:
Green: Up (operational)
Red: Down (non-operational)
Yellow: Paused (monitoring paused for this service)
Response time: A visual graph showing the performance trends of the service over time. Each bar represents the response time of the service at a given interval. Green bars indicate a healthy response time, while red bars indicate slower or problematic performance.
Type: Indicates the type of service being monitored (either Ping or HTTP).
Actions: This column has settings icons that allow the user to configure the monitoring details of the specific service.
At the top-right corner of the dashboard, there’s a button labeled Create monitor. This allows users to add a new server or website to monitor.
A search bar is available above the list of monitored services, enabling users to quickly locate specific services by name or URL.
Status indicators
Green: Indicates the service is currently up and operational.
Red: Indicates the service is down or experiencing problems.
Yellow: Indicates that monitoring for this service is paused.
Each service has a graph in the Response Time column that displays its performance history over time. This allows you to easily visualize any spikes or drops in performance.
The gear icon next to each monitored service allows for quick access to configuration settings or additional monitoring options.
Table actions

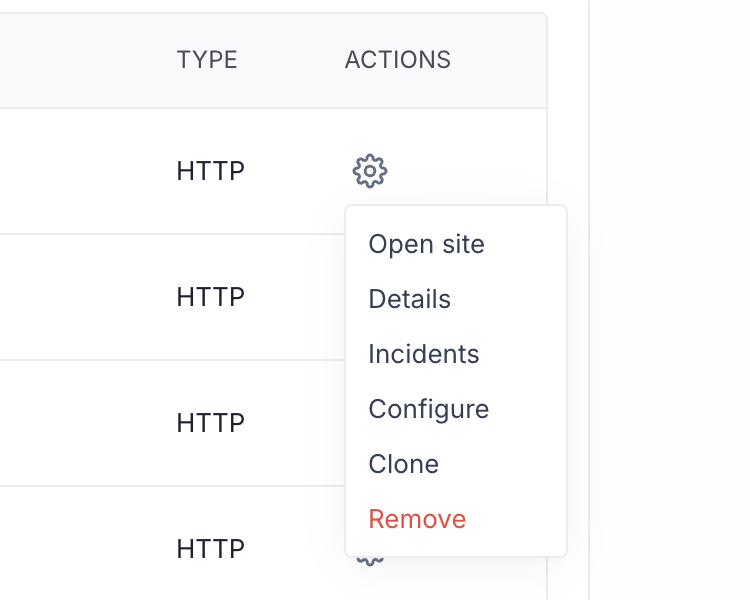
When you click on the gear icon, you'll see a few options that correspond to that host:
Open site: Opens the monitored website or server in a new browser tab.
Details: Displays historical uptime and performance metrics for the service.
Incidents: Shows a log of all incidents related to the service, including downtime and performance issues.
Configure: Allows modification of monitoring parameters like check frequency and alert preferences.
Clone: Duplicates the current service’s monitoring settings for a new service.
Remove: Removes the service from the monitored list and stops all monitoring activities.
Was this helpful?